CVD Z Score

This indicator is a Z-score–normalized order flow tool, built around Cumulative Volume Delta (CVD) and per-bar delta, designed to measure how aggressive buying or selling is relative to recent history.
🧠 Core concept
At its heart, this script tracks order flow imbalance:
- Buys (
orderflow.buy) → aggressive market buying - Sells (
orderflow.sell) → aggressive market selling - Delta = Buys − Sells → net aggression per candle
It then standardizes this using a Z-score, so instead of raw numbers, you see:
👉 “How extreme is current buying/selling compared to normal?”
📊 Two operating modes
1. useDeltaZ = true (default)
Uses per-bar delta
Focuses on short-term aggression spikes
👉 Best for:
Scalping
Spotting sudden buying/selling bursts
2. useDeltaZ = false
Uses CVD (cumulative delta)
Focuses on position buildup over time
👉 Best for:
Trend confirmation
Detecting sustained accumulation/distribution
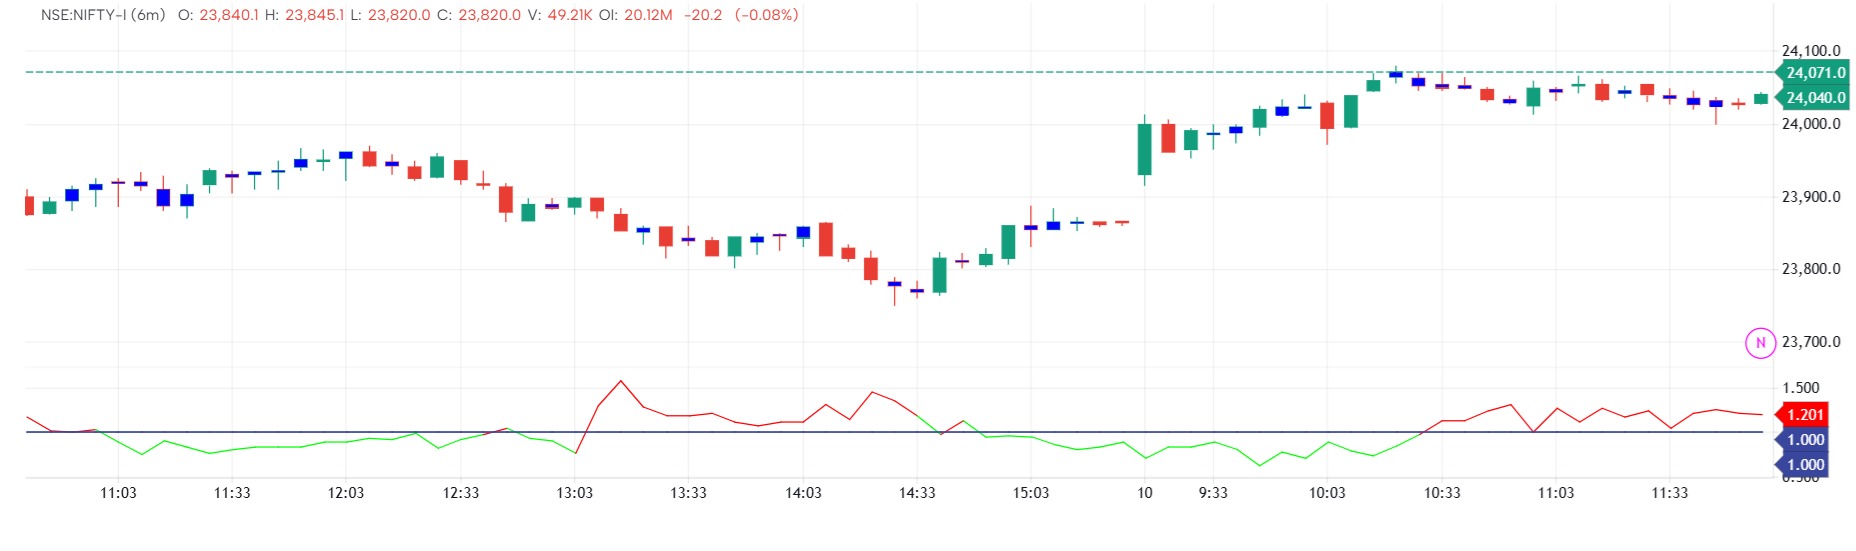
📈 Z-score interpretation
🟢 Above 0 (green fill)
Buying pressure dominates
Positive delta relative to average
Indicates buyers are more aggressive than usual
👉 Context matters:
Rising price + positive Z → strong bullish participation
Falling price + positive Z → possible absorption (hidden selling)
🔴 Below 0 (red fill)
Selling pressure dominates
Negative delta relative to average
Indicates sellers are more aggressive than usual
👉 Context:
Falling price + negative Z → strong bearish conviction
Rising price + negative Z → possible hidden accumulation
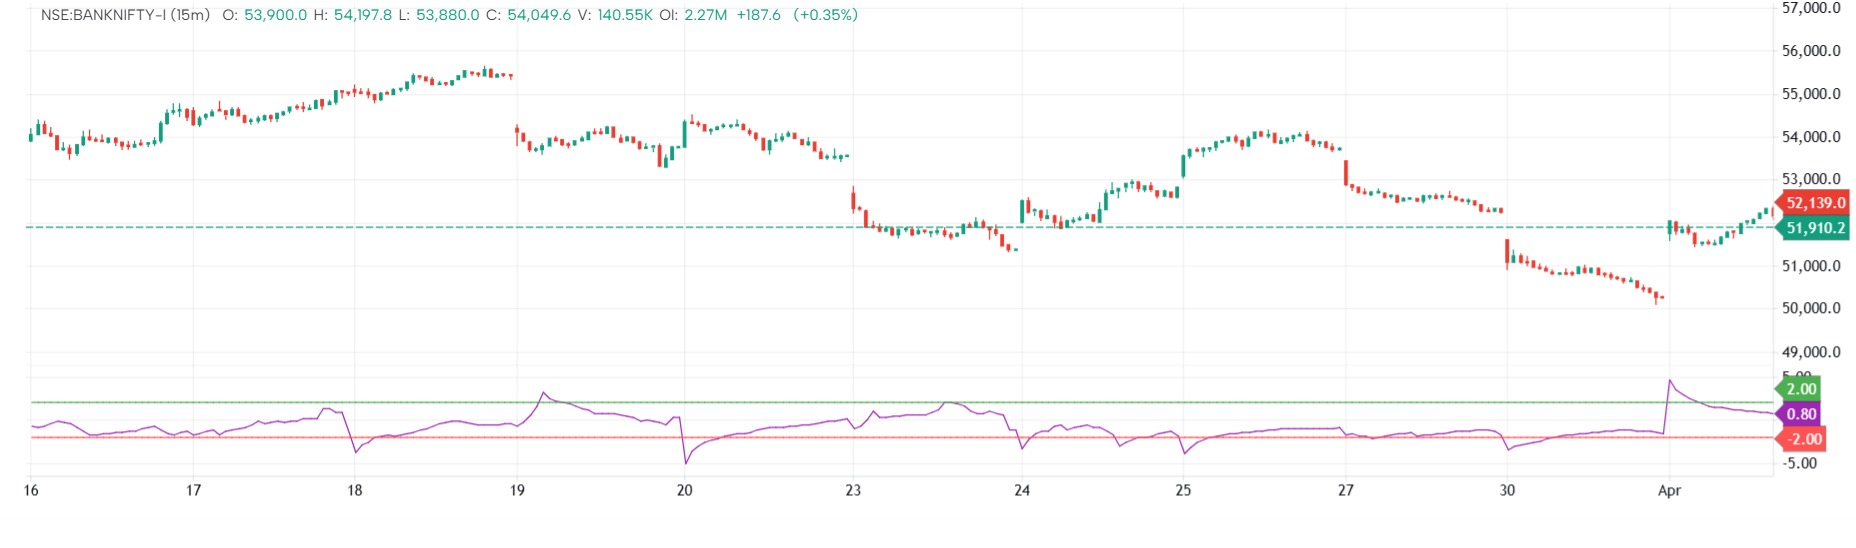
⚡ Extreme values (|Z| > 2 or 3)
Statistically rare events
Signal unusual order flow imbalance
These zones often precede:
Liquidity grabs
Exhaustion moves
Sharp reversals or continuation bursts
🎛️ Smoothing logic
The indicator applies optional smoothing:
- SMA smoothing → stable, less noisy
- EMA smoothing → faster, more reactive
👉 Effect:
Reduces noise from raw delta spikes
Makes trends in order flow easier to read
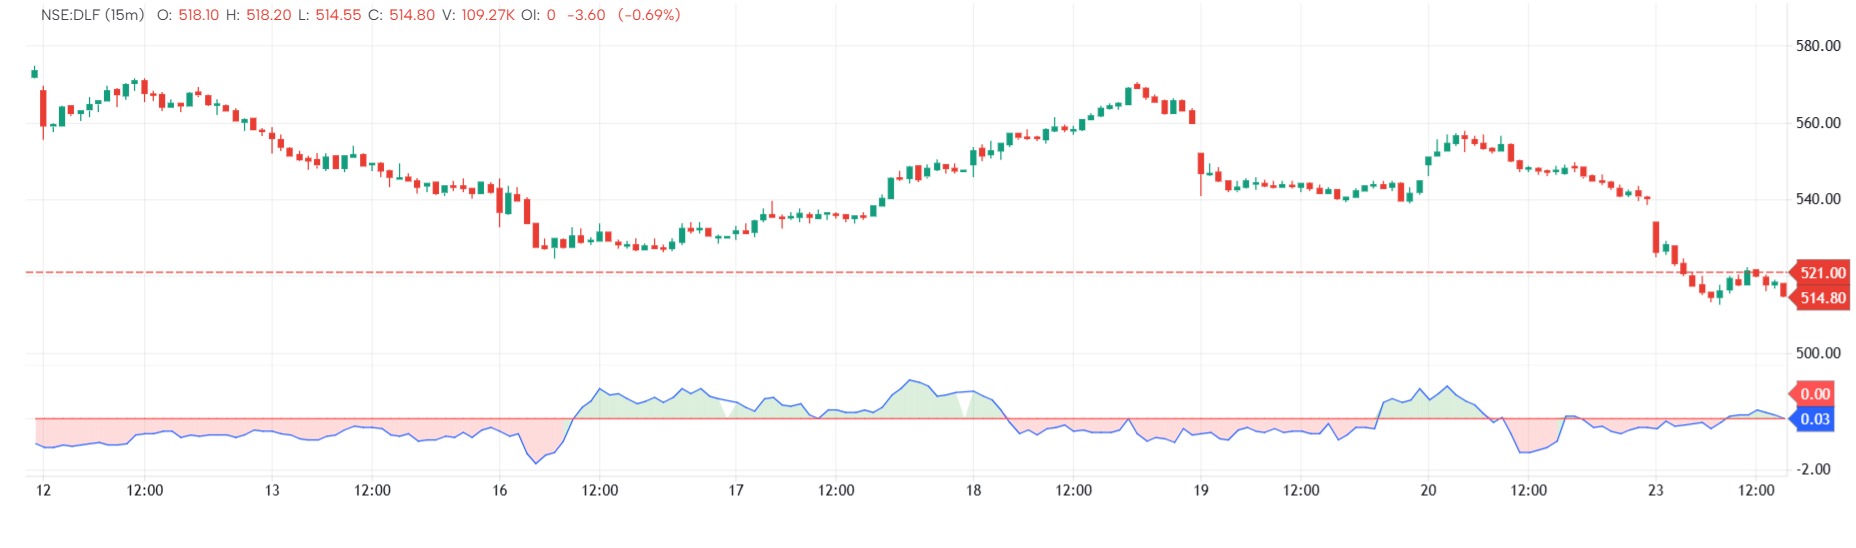
🎨 Visual structure
- Blue line (
zLine) → normalized order flow strength - Zero line (red) → neutral boundary
- Fill:
Green → bullish dominance
Red → bearish dominance
This creates a momentum-style oscillator, but based on real trading activity, not price alone.
The information and publications are not meant to be, and do not constitute, financial, investment, trading, or other types of advice or recommendations supplied or endorsed by GoCharting. Read more in the Terms of Use.
Related Scripts
Comments (1)
Loading comments…