Real CVD

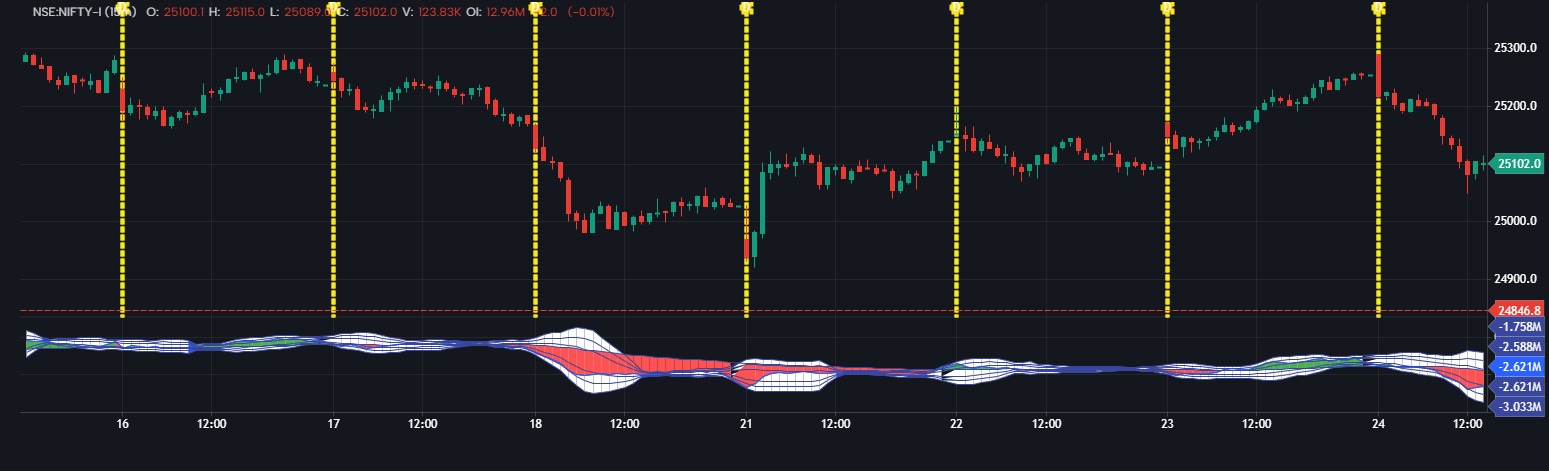
🔍 Real CVD Indicator – Short Analysis
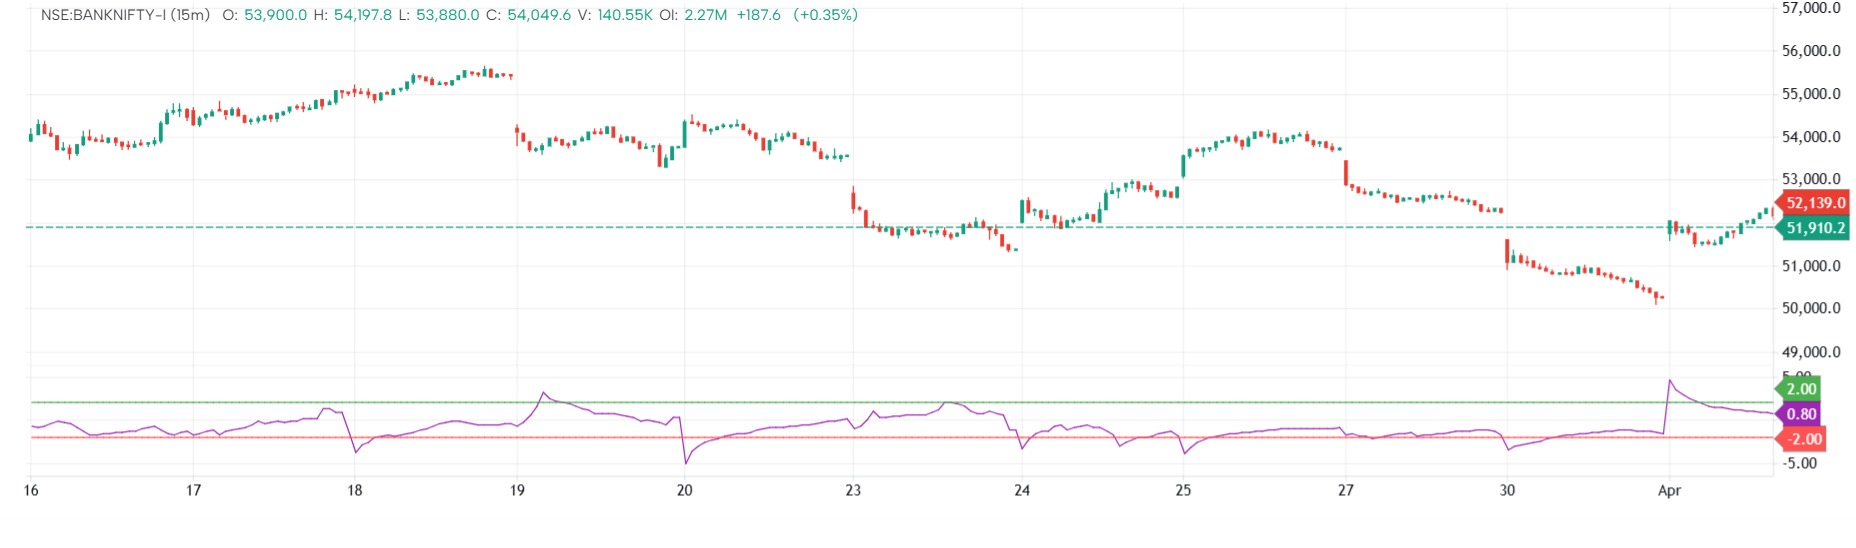
This script plots a Cumulative Volume Delta (CVD) along with its moving average and standard deviation bands, giving insights into volume pressure and market strength.
Key Features:
📈 CVD Calculation
Uses buy volume if the candle is bullish (close > open), else sell volume.
CVD is accumulated using talib.cum().
📊 Bollinger-style Bands:
1, 2, and 3 standard deviation bands (upper & lower) around a short SMA of CVD.
Bands adapt based on recent volatility.
🟦 Dynamic Fill Zones:
Fills between bands with blue when the current volatility is lower than a long-term average — signaling low activity or coiling.
🟩🟥 Momentum Zone Fill:
Fills between raw CVD and its EMA.
Green fill = bullish momentum (CVD > EMA)
Red fill = bearish momentum (CVD < EMA)
✅ Use this to spot:
Momentum shifts (via EMA crossover)
Accumulation/distribution pressure
Volatility contractions before breakouts
The information and publications are not meant to be, and do not constitute, financial, investment, trading, or other types of advice or recommendations supplied or endorsed by GoCharting. Read more in the Terms of Use.
Related Scripts
Comments (0)
Loading comments…