Reactive Liquidity Layers (RLL)

This script's source code is protected by the author.
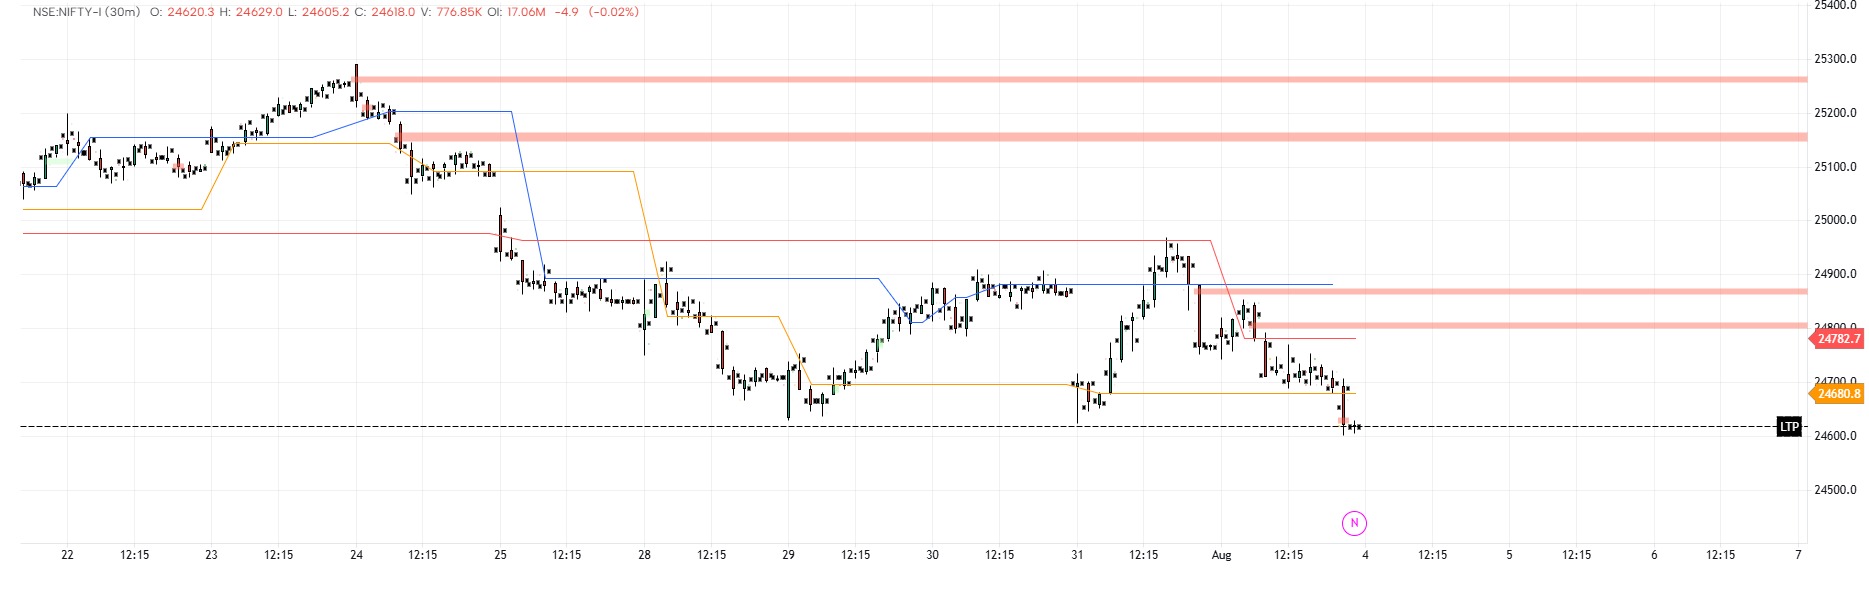
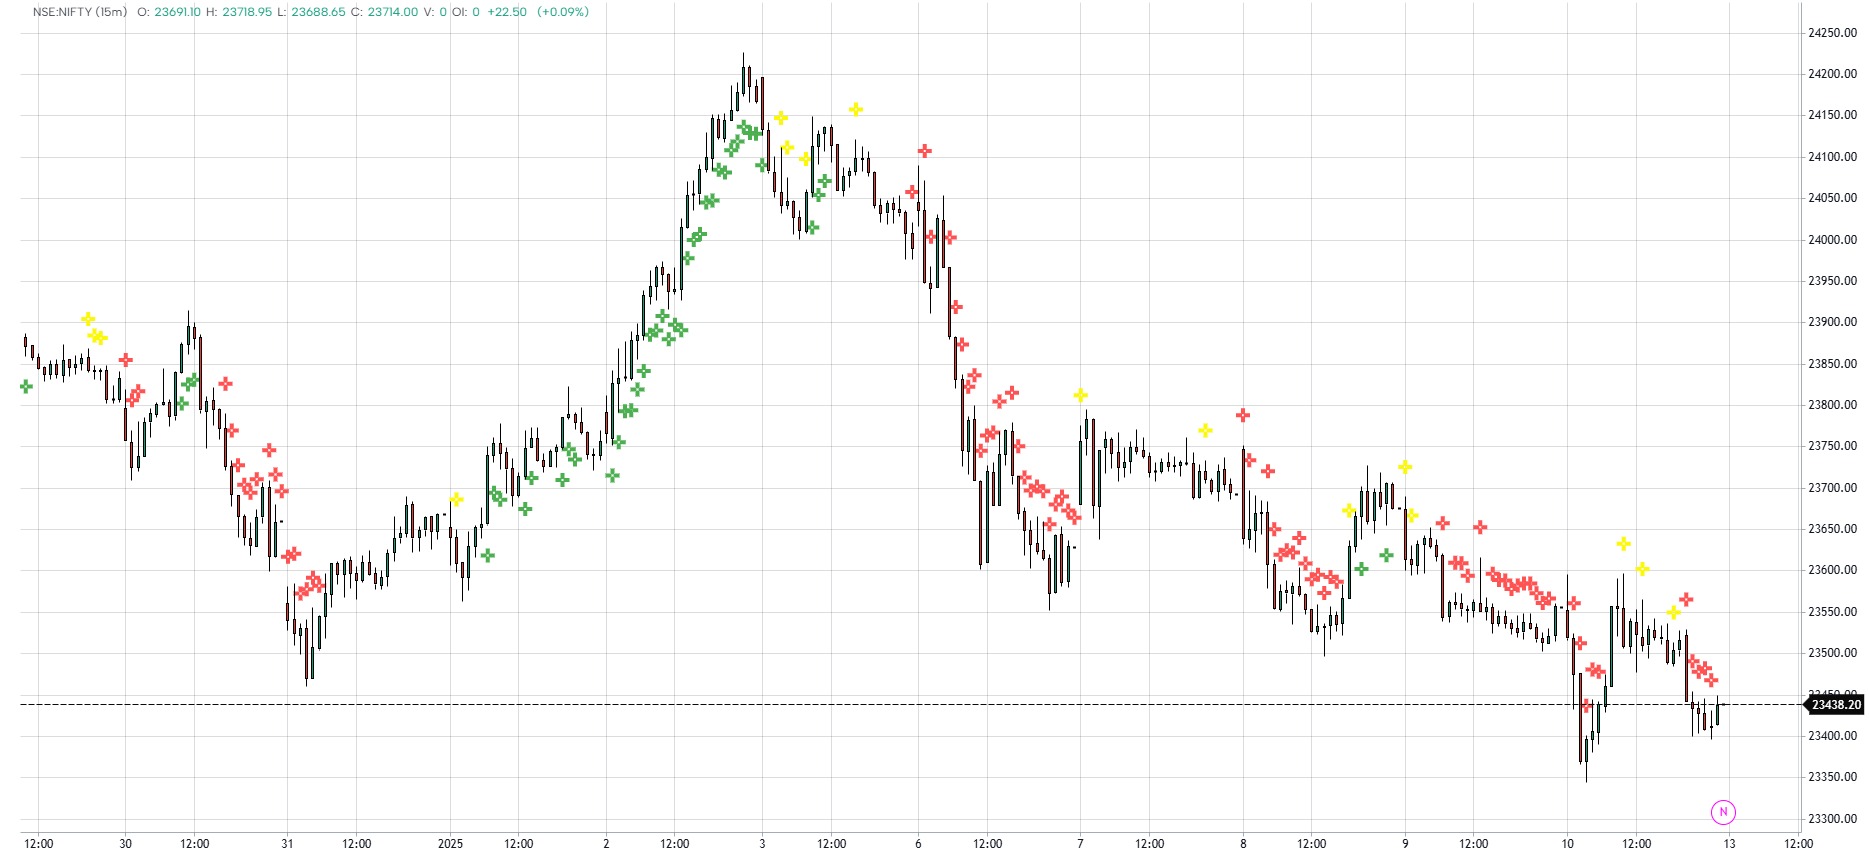
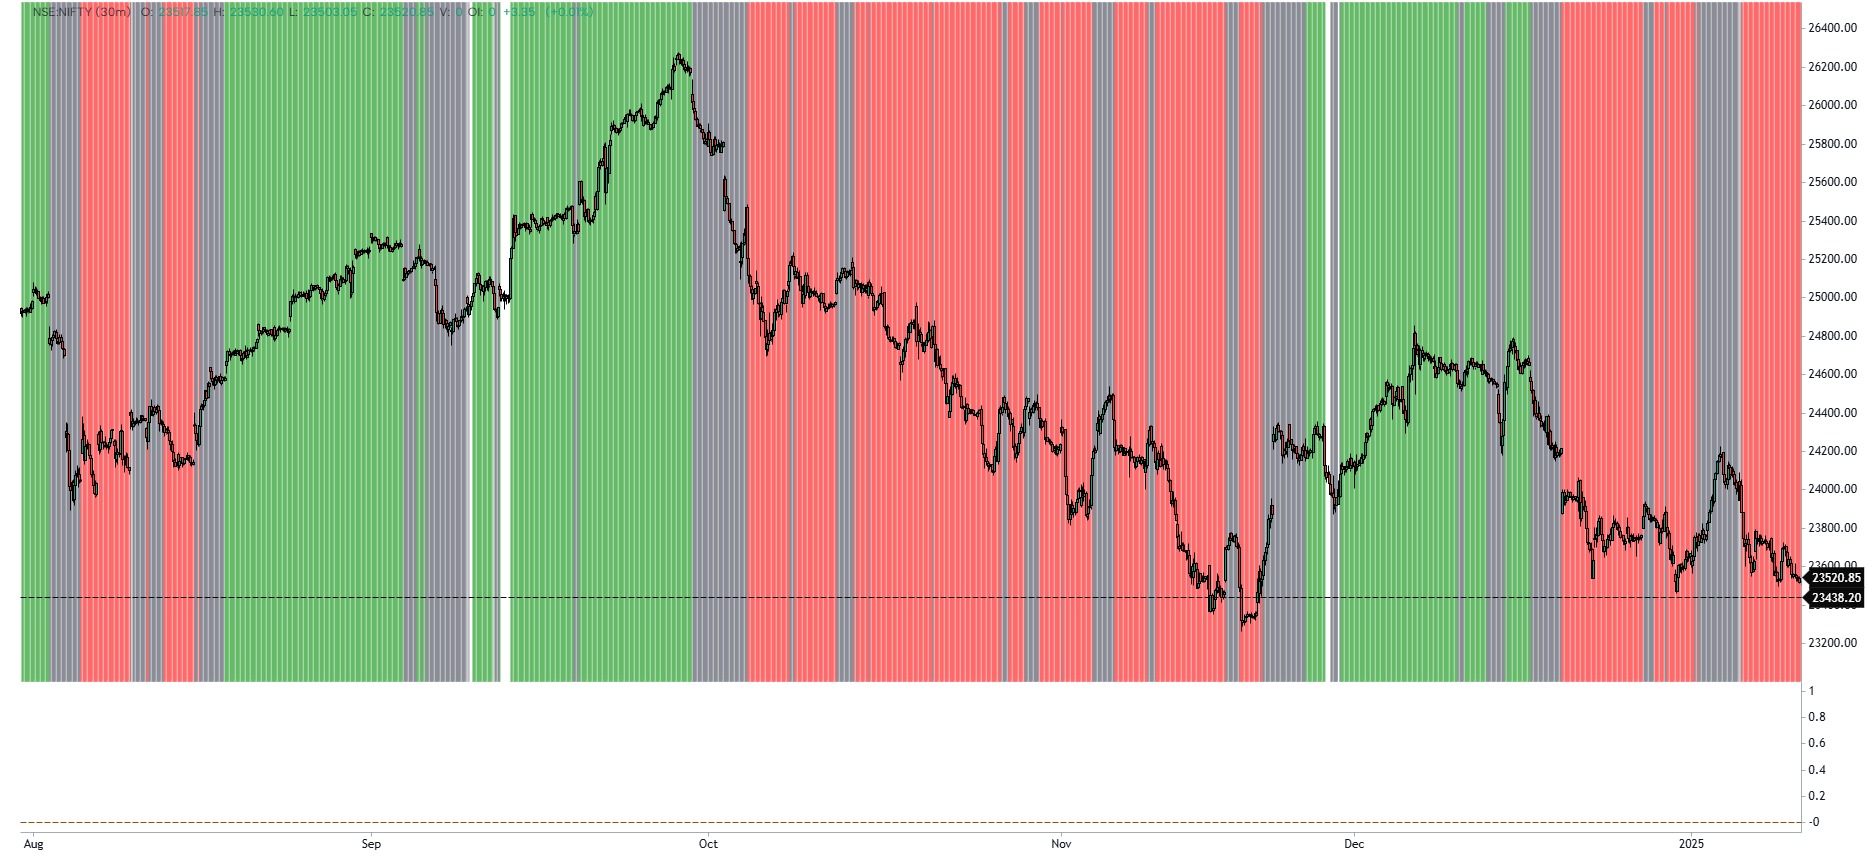
Reactive Liquidity Layers (RLL) is a precision tool designed to visualize dynamic market zones where significant volume interactions are likely to occur. These layers adapt to evolving price action and aim to identify key levels of interest in both trending and ranging environments.
Highlights:
-Tracks and visualizes reactive price levels based on underlying market behavior
-Intensity-based color zones for quick visual reference (Red-High,Orange-Mid,Blue-Low)
-Works across multiple asset classes and timeframes
How to Use:
-Use the plotted levels as potential support and resistance
-Observe how price behaves around these zones for entries or exits
-Can be paired with your preferred strategy for confluence
The information and publications are not meant to be, and do not constitute, financial, investment, trading, or other types of advice or recommendations supplied or endorsed by GoCharting. Read more in the Terms of Use.
Related Scripts

Comments (16)
Loading comments…