← All Scripts
ProtectedRSATRENDCCI
Trend Momentum

This script's source code is protected by the author.
Settings and Features:
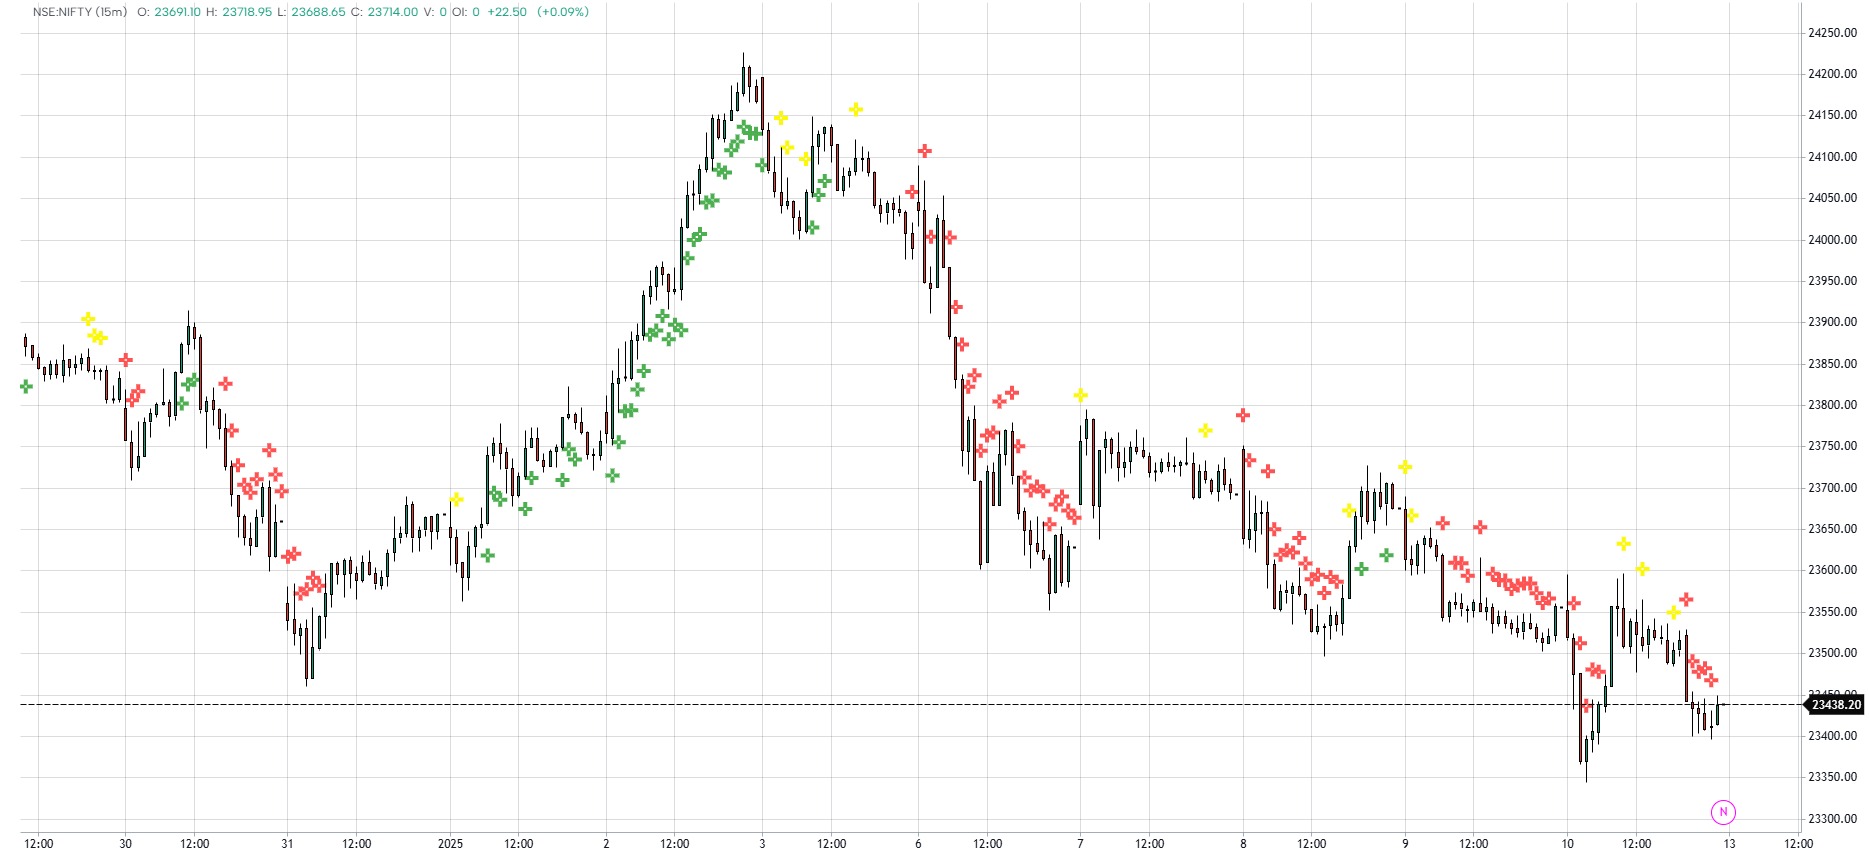
On/Off Toggle: A simple on/off toggle (Show Trend Momentum) is provided, allowing users to enable or disable the display of buy, sell, and neutral signals on the chart.
Signal Plotting: Signals are displayed as labels:
Buy: Green label below the bar.
Sell: Red label above the bar.
Neutral: Yellow label above the bar.
Usage:
This indicator helps traders visualize when market momentum is strong enough to initiate buy or sell trades. The neutral zone signals indecision or lack of momentum, which can be useful for avoiding trades during sideways market conditions.
By using both RSI and CCI together, traders can filter out false signals and focus on more reliable trends.
Example:
Buy Signal: The price is rising, and both RSI and CCI show strong bullish conditions (RSI > 60, CCI > 10). This is a signal to consider entering a long position.
Sell Signal: The market is showing weakness (RSI < 40, CCI < -10), signaling a possible short or exit from a long position.
Neutral Signal: When both RSI and CCI are within their middle ranges (RSI between 40 and 60, CCI between -10 and 10), it indicates indecisiveness, suggesting that no trade should be made.
This indicator is ideal for trend-following traders looking to capitalize on significant market movements while avoiding trades in neutral or consolidating conditions.
Disclaimer
The information and publications are not meant to be, and do not constitute, financial, investment, trading, or other types of advice or recommendations supplied or endorsed by GoCharting. Read more in the Terms of Use.
Related Scripts

Comments (0)
Loading comments…