Straddle Your Way Out of Uncertainty In US Equities

Only reason economists make forecasts is to make the weatherman look good. Not too long ago, analysts rejoiced American Exceptionalism, advocating continued pumping of funds into US equities. Six months on, doom and gloom everywhere

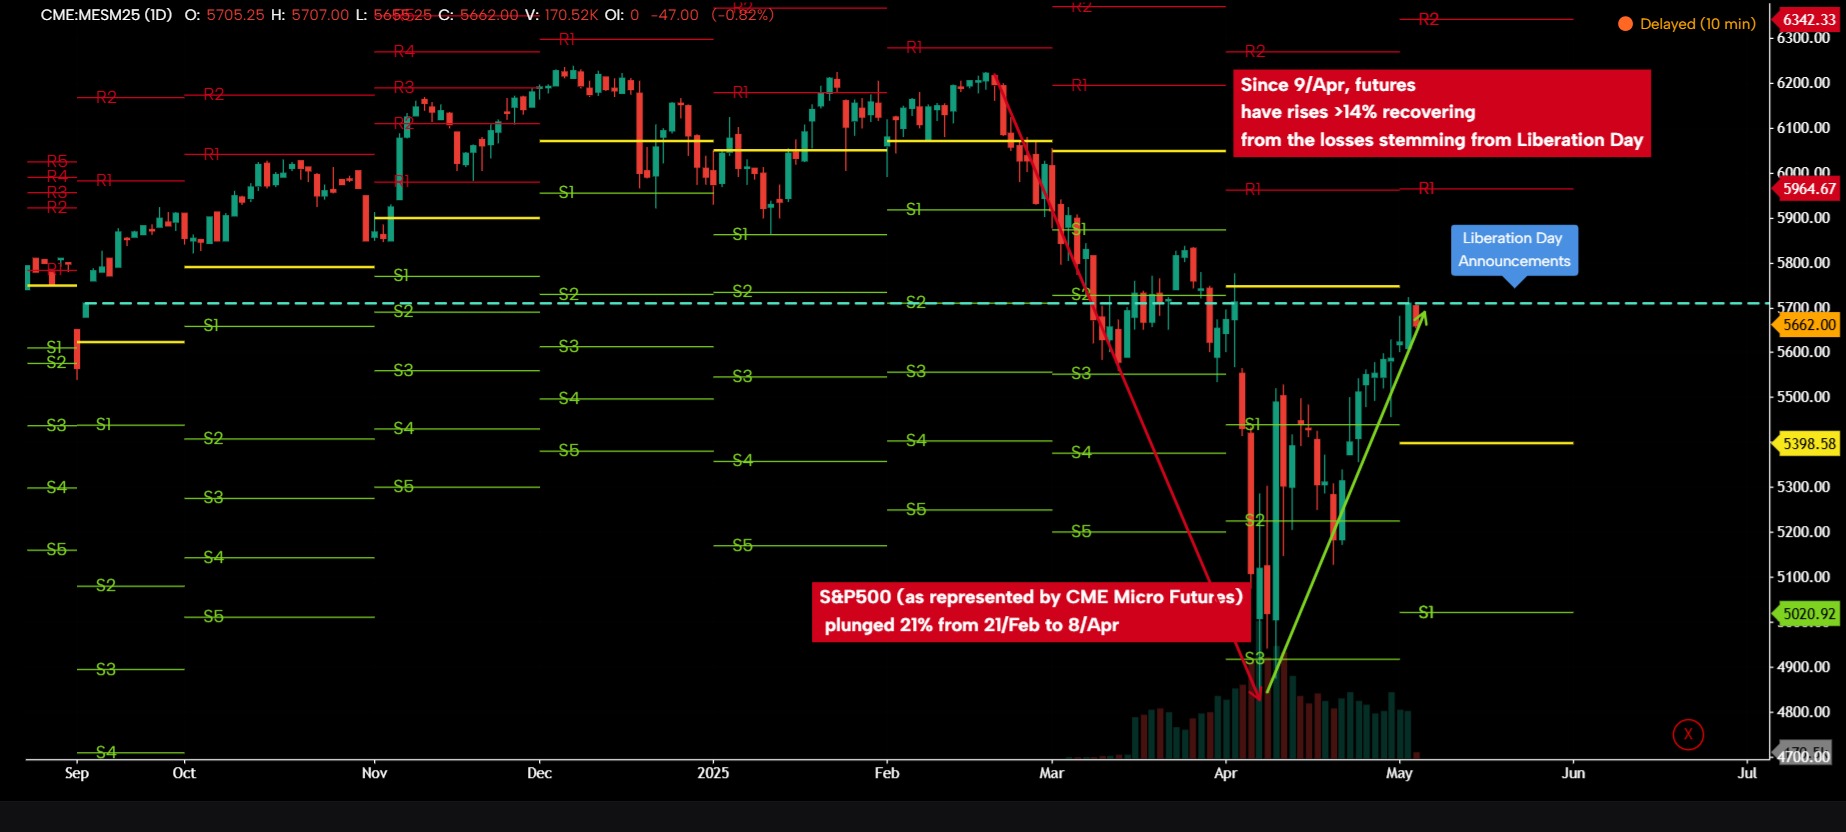
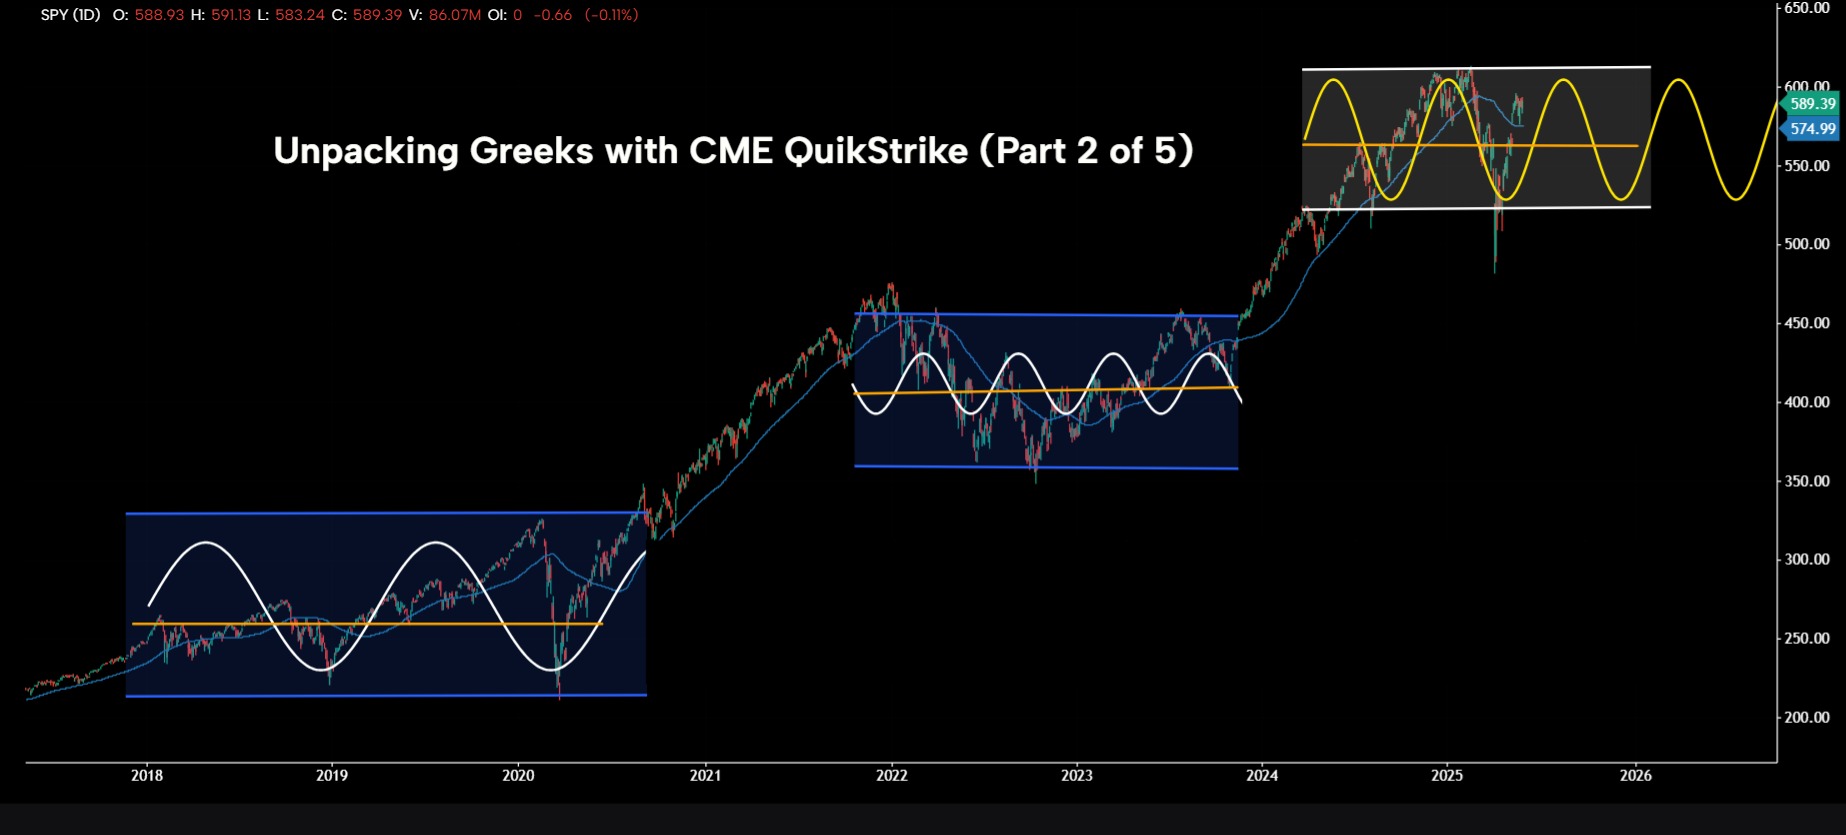
If analysts have radically changed their minds, they have a good reason to do so. The S&P 500 has gyrated with moves mimicking meme crypto coins. Remember, this is a broad index of 500 top US firms. Source: Gocharting.com
Having recouped Liberation Day losses, some are pinning hopes of brighter days ahead. Certain metrics point to a healthy correction that should pave the path for a strong performance ahead.
The "Buffett Indicator" measures the ratio of US stock market's total value to the dollar value of US GDP. This stands at 180%, signalling that equities are relatively cheap as reported by Bloomberg. Take that with a fist of salt, this ratio is well above past market bottoms when it fell to nearly 100% during Covid crash.

Source: Bloomberg
Although the Buffet indicator is flashing “cheap”, Berkshire’s cash holdings continue to rise to a staggering USD 347.7 billion. If the grandmaster isn’t finding anything interesting to buy, then should we reconsider holdings in our own portfolios?
At the start of the year, majority of the institutions forecasted for S&P500 to clock in 10%-15% returns. Most of these houses have revised down their forecasts now with many now expecting a sharp decline.

Source: VisualCapitalist
S&P500 index closed on 2nd May 2025 at 5687 (down 3.3% YTD) compared to 5881 as of 31st December 2024.
Only Wells Fargo analysts still have the nerve to forecast S&P 500 closing above 7000 (+23%) by year end. Meanwhile, UBS and Morgan Stanley analysts remain sanguine enough to predict 2025 exit at 6400 (+12.5%) & 6500 (+14.3%), respectively. Others such as JP Morgan see more and potentially unseen headwinds and forecast the index to exit the year at 5200 (-8.6%).

Source: Yahoo! Finance
Forecasting is important but forecasts are useless based on the track record of equity strategists. In 13 of the last 25 years, actual returns have fallen outside the range of forecasts.

Source: Bloomberg
Rare are the years which have plunged badly and then recovered. Prudence would require portfolio manager to consider carefully crafted hedges to navigate a surprise rally or a repeat downdraft. Only on three occasions, has the S&P recovered to finish in positive territory after dropping 15% or more at any point during the year.

Source: Bloomberg
President Trump often uses stock markets as a scorecard of his administration. It is not his preferred position to see markets tank and for it to remain there .The President will try everything in his might to revise the markets. Will it work? That’s another story.
If anyone tells you they know what’s going on in equity markets, they are either lying or deluded or both. Amid such upheaval across geopolitics, monetary policy landscape, and a US administration that is spectacularly unpredictable, prudent investors realise the importance of positioning to gain from sharp moves in either direction.
Hypothetical Trade Set Up
The VIX which represents the normalised implied volatility on S&P 500 Options, had spiked sharply following Liberation Day. It has since eased. It is still well above the levels observed during 2023, 2024 and much of 2025. Securing protection both to the downside and upside is an astute move during times like these.
This paper posits a portfolio manager to consider protection from sharp moves on either side.

CME Group offers deeply liquid equity derivatives covering the S&P 500 market. It offers futures and options in both the full standard contract size and the micro version. The options on Micro E-Mini S&P 500 Futures enable granular & affordable portfolio hedging strategies.
Using these feature-rich products, portfolio managers can construct prudent risk management positions to limit downside risk while also gaining from upside price moves.
To gain from sharp moves on either direction and to harvest yields from gamma scalping, an astute portfolio manager can establish a long straddle in CME S&P500 E-Mini Micro Options on Futures with a long 5750 call and combining it with a long 5750 put expiring on 19th September 2025, paying an upfront aggregate premium of 555.29 index points. Each index point represents USD 5, and this translates into USD 2,776.45 in dollar terms.
At expiry, the upper breakeven point for this long straddle is at 6305.29 (5750 + 555.29) with the lower breakeven point at 5194.71 (5750 – 555.29). The pay-off from the long straddle is illustrated below.

Source: CME QuikStrike
This long straddle gains in value when (a) the underlying index futures makes large moves, (b) volatility spikes, and/or (c) both occur. Conversely, the straddle shed value resulting in losses when (a) underlying index futures remain muted without making sharp moves, (b) volatility shrinks, and (c) both occur.
Take note that astute options portfolio managers can also harvest gains from gamma-scalping from the date of establishing this trade until options expiry.
Gamma scalping is a sophisticated trading strategy that requires shrewd risk management and sharp market analysis.
It involves trading the underlying assets to systematically profit from the underlying asset's price movements, while keeping the overall delta of the portfolio neutral. More on this in a future research note.
MARKET DATA
CME Real-time Market Data helps identify trading set-ups and express market views better. If you have futures in your trading portfolio, you can check out on CME Group data plans available that suit your trading needs https://deva.gocharting.com/cme .
DISCLAIMER
This case study is for educational purposes only and does not constitute investment recommendations or advice. Nor are they used to promote any specific products, or services.
Trading or investment ideas cited here are for illustration only, as an integral part of a case study to demonstrate the fundamental concepts in risk management or trading under the market scenarios being discussed. Please read the FULL DISCLAIMER.
The information and publications are not meant to be, and do not constitute, financial, investment, trading, or other types of advice or recommendations supplied or endorsed by GoCharting. Read more in the Terms of Use.
↗ Related Analyses
Comments (0)
Loading comments…