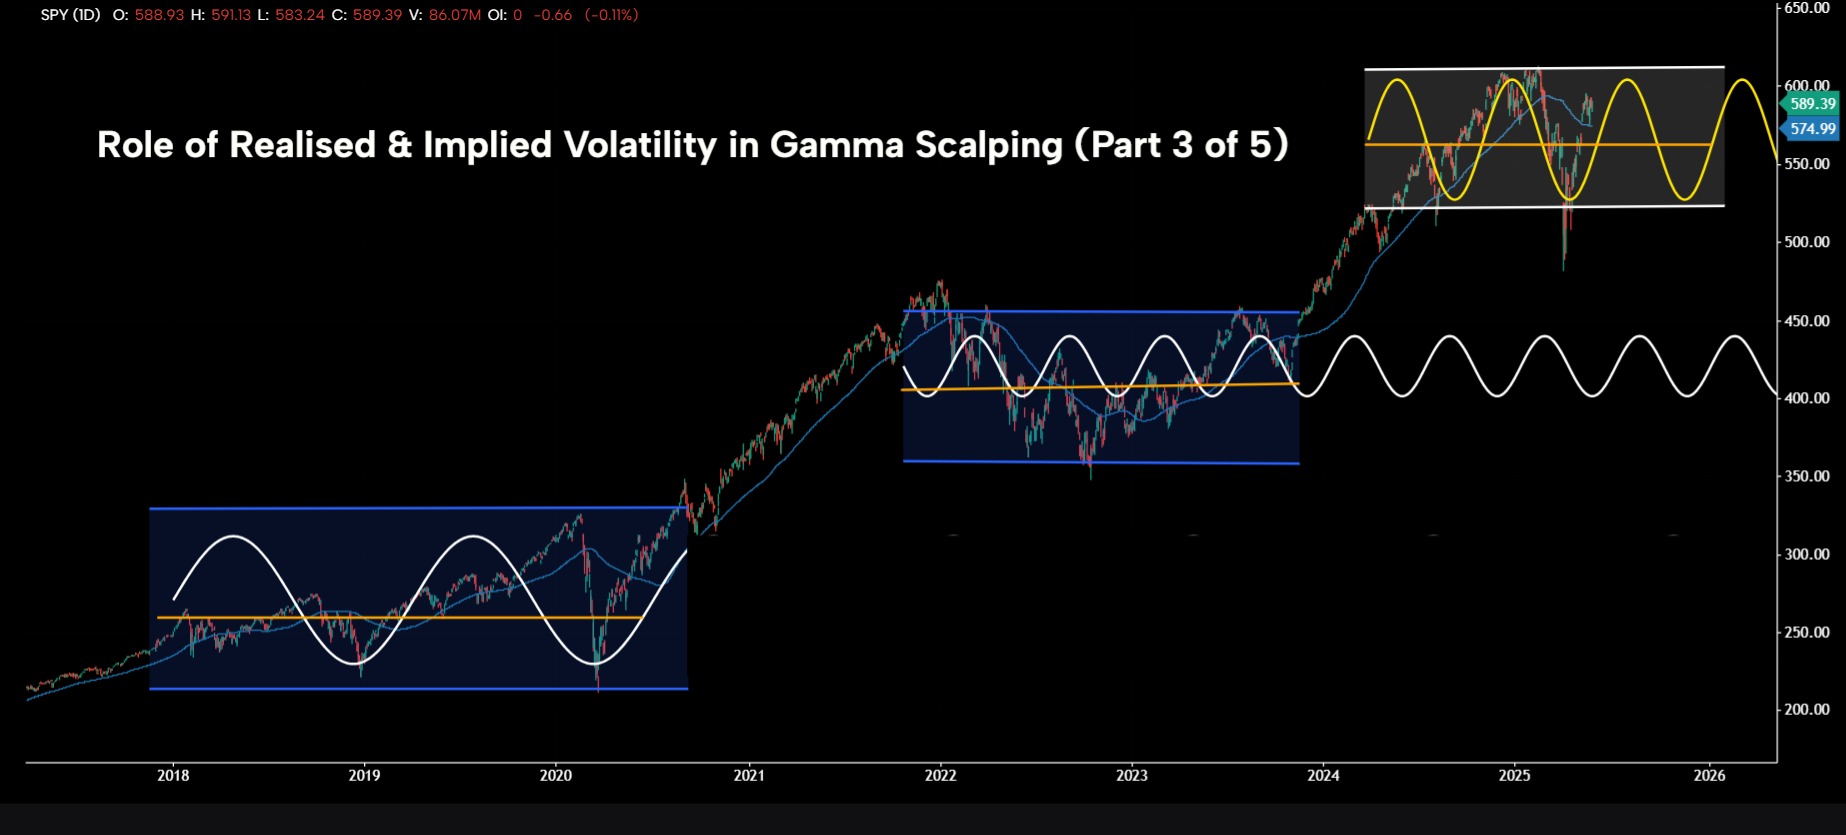
Role of Realised & Implied Volatility in Gamma Scalping (Part 3 of 5)

Volatility is a measure and refers to the dispersion of numerical values away and around an average. Volatility is defined as the annualised standard deviation of logarithmic daily returns of asset prices in financial & commodity markets.
Ordinary equity and futures traders are chiefly interested only in the direction of travel of asset prices. However, options traders are not only interested in direction but also the speed of travel of asset prices.
In simple words, volatility is a measure of the speed of the market. Low volatility markets are those where prices move slowly. Fast moving prices are referred to as high volatility markets.
Volatility in options refers to the dispersion in the price of underlying assets. There are two main types of volatility: Realized Volatility (RV) and Implied Volatility (IV).
PINBALL MAZE TO UNPACK VOLATILITY
Imagine a pinball maze through which balls fall randomly into a trough. If an infinite number of balls pass through the nails, they will begin to follow a bell-shaped curve referred to as Normal Distributions.

Chart 1: Distribution of Balls Passing Through a Pinball Maze (MathsIsFun)
DISTRIBUTIONS COME IN DIFFERENT SIZES
Depending on the nature of the asset, micro, and macro environment impacting the asset prices, the price distribution of an asset can vary.

Chart 2: High Volatility Distribution Results in Fat Tails (Option Volatility & Pricing, Sheldon Natenberg)
REALISED VOLATILITY (“RV”) IS A LOOK BACK
RV is a measure of actual price movements of an asset over a specific period. It is calculated by (a) computing the standard deviation of the assets daily logarithmic returns, and then (b) annualising the standard deviation.
GoCharting platform comes with an embedded indicator for computing realised volatility.

Chart 3: CME S&P500 Futures Front Month Contract’s Realised Volatility since 2021 (GoCharting)
RV enables investors to better grasp the historical risk. RV is also referred to as Historical Volatility (RV).
IMPLIED VOLATILITY IS AN EXPECTATION
Implied Volatility derives its name from the fact that this volatility measure is implied from an options prices are quoted and/or traded in the market place.
Pricing an option-on-futures contract requires five inputs, namely, (a) Current underlying price, (b) Strike price, (c) Time to expiry, (d) Risk-free rate, and (e) Implied Volatility.
As such, options price as quoted and/or traded in the market has IV baked into it. Working backwards, options pricing tool can compute the volatility that is implied by the price of the option and hence the term Implied Volatility.

Exhibit 1: Options Pricing Calculator (CME QuikStrike)
IV is a forward-looking measure that estimates the future price movements of an asset. While trading options, IV is what is getting traded.
MAPPING THE RELATIONSHIP BETWEEN REALISED & IMPLIED VOLATILITY

Chart 4: CME E-mini S&P 500 futures 30-day ATM IV and 20-day RV (CME QuikVol)
Implied volatility (IV) is higher thanhistorical volatility (RV), reflecting the risk premium tied to the uncertaintyof forecasting future volatility. While short-term deviations from this pattern can occur, as shown in Chart 4, the longer-term trend—illustrated in Chart 5—makes this relationship more evident.

Chart 5: Contrasting SPY historical volatility with adjusted forward implied volatility since 2021 (Barchart)
In gamma scalping, traders aim to capitalize on periods when this relationship reverses—specifically, when realized (or historical) volatility exceeds what was implied. These scenarios offer potential profit opportunities, as the market underestimated actual price movement.
It is important to recognize that while IV and RV can move in tandem, especially around risk events, IV reflects market expectations of future volatility. Temporary spikes in IV, triggered by risk events, may not translate into actual volatility if the events pass without a sustained impact. For this reason, entering gamma scalping strategies around risk events may not be ideal.
Furthermore, since a gamma scalping strategy involves going long volatility, it is not effective to enter the strategy during periods of declining volatility. The most favourable conditions are transitions from low to high volatility, though these shifts are difficult to anticipate. As previously noted, volatility tends to cluster.

Chart 6: Contrasting SPY historical volatility with adjusted forward implied volatility since 2021 with key periods to enter gamma scalping annotated (Barchart)
THREE KEY PROPERTIES OF VOLATILITY
Volatility exhibits these three unique characteristics:
1. Volatility Clustering: Volatility tends to cluster. In other words, high volatility environments are followed by more periods of high volatility. Likewise, low volatility market conditions are followed by more periods of low volatility.
2. Mean Reversion: Volatility exhibits mean reversion. It tends to revert to its historical average over time.
3. Volatility Skew: IV can vary across different strike prices and expiration dates, resulting in a volatility skew. Options skew enables insights into market sentiments, bias towards risk to the upside or the downside.
INTRODUCTION TO CME CVOL TOOL
CME Group Volatility Index (CVOL) is a powerful rich tool delivering a raft of information related to IV across various asset classes.

Chart 7: CVol End of Day Volatility Index Measures Over the Last Six Months (CME CVol)
CVol is derived from the prices of options on futures contracts and provides a comprehensive view of market sentiment and potential risk.
Each of the tile above opens a chart akin to the one exhibited below for Gold volatility history. The chart shows the (a) CVol index (volatility index based on standard variance), (b) Down Var (risk of prices falling), (c) Up Var (risk of prices rallying), (d) Skew (Up Var – Down Var), (e) Skew Ratio (Up Var / Down Var), (f) ATM (volatility for ATM options, (g) Convexity (CVOL / ATM), and (h) Underlying prices.


Chart 8: CME Gold CVol History (CVol) with (a) Down Var and Up Var (b) Skew and Skew Ratio, and (c) ATM and Convexity (CME CVOL)
IN CONCLUSION
As mentioned previously, Gamma Scalping is both science and art. Gamma scalping profits from the market’s speed or volatility. You buy options priced on implied volatility and repeatedly hedge using the underlying whenever realized swings outrun that forecast. Bigger, faster moves unlock additional gains from the option’s gamma; slow, quiet markets give nothing. Success therefore hinges on spotting shifts in volatility such that realized volatility outpaces what was priced in with implied volatility.
In part 4 of this series, we will unpack the risks involved in Gamma Scalping.
MARKET DATA
CME Real-time Market Data helps identify trading set-ups and express market views better. If you have futures in your trading portfolio, you can check out on CME Group data plans available that suit your trading needs https://deva.gocharting.com/cme .
DISCLAIMER
This case study is for educational purposes only and does not constitute investment recommendations or advice. Nor are they used to promote any specific products, or services.
Trading or investment ideas cited here are for illustration only, as an integral part of a case study to demonstrate the fundamental concepts in risk management or trading under the market scenarios being discussed. Please read the FULL DISCLAIMER.
The information and publications are not meant to be, and do not constitute, financial, investment, trading, or other types of advice or recommendations supplied or endorsed by GoCharting. Read more in the Terms of Use.
↗ Related Analyses
Comments (0)
Loading comments…