Orderflow buy/sell volume graph

This script's source code is protected by the author.
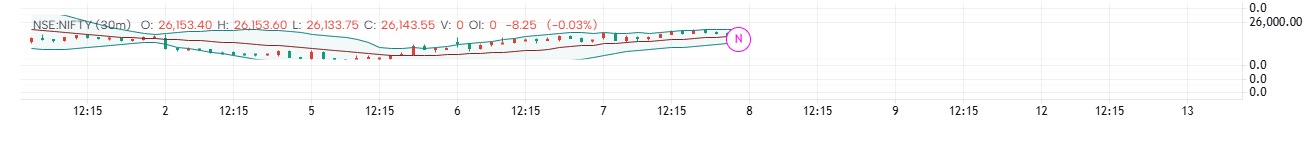
This indicator visualizes real-time orderflow activity by separating Buy Volume, Sell Volume, and Delta into an easy-to-read graphical format.
What this indicator shows
Buy Volume (Green Line):
Represents aggressive market buying executed at the ask price.
Sell Volume (Red Line):
Represents aggressive market selling executed at the bid price..
How it helps traders
Identifies institutional participation through volume aggression.
Detects hidden accumulation or distribution even when price is moving sideways.
Highlights trend strength and weakness using delta expansion and contraction.
Helps confirm breakouts, reversals, and continuation trades.
Useful for scalping, intraday, and positional trading.
The information and publications are not meant to be, and do not constitute, financial, investment, trading, or other types of advice or recommendations supplied or endorsed by GoCharting. Read more in the Terms of Use.
Comments (1)
Loading comments…