← All Analyses XAUUSDneutral
Liquidity Sweep - 15M Time Frame

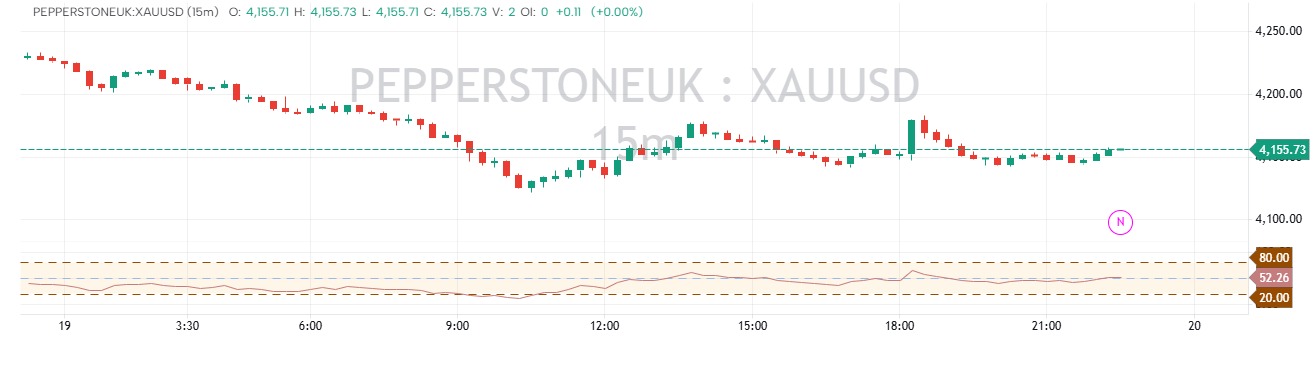
here's a 15-minute liquidity zone indicator that identifies:
Swing High Liquidity (Buy-side liquidity)
Swing Low Liquidity (Sell-side liquidity)
Liquidity zones extend into the future
Optional liquidity sweep detection
How it works
- Red horizontal lines = Buy-side liquidity (above swing highs).
- Green horizontal lines = Sell-side liquidity (below swing lows).
When price:
moves above a swing high and closes back below → Buy-side sweep (BSL).
moves below a swing low and closes back above → Sell-side sweep (SSL).
Best settings for the 15-minute timeframe
SettingValueLeft Bars5Right Bars5Zone Extension30–50 bars
Possible improvements
A more advanced "smart money" liquidity indicator can also include:
Equal Highs / Equal Lows (EQH/EQL)
Fair Value Gaps (FVG)
Order Blocks (OB)
Break of Structure (BOS)
Change of Character (CHOCH)
Liquidity heatmap with dynamic zones
Automatic removal of consumed liquidity
Multi-timeframe liquidity (1H, 4H, Daily overlaid on the 15m chart)
Those features provide a more complete ICT/Smart Money Concepts workflow than simple pivot-based liquidity lines.
Disclaimer
The information and publications are not meant to be, and do not constitute, financial, investment, trading, or other types of advice or recommendations supplied or endorsed by GoCharting. Read more in the Terms of Use.
Comments (0)
Loading comments…