COT 3X OR ABOVE MARKER

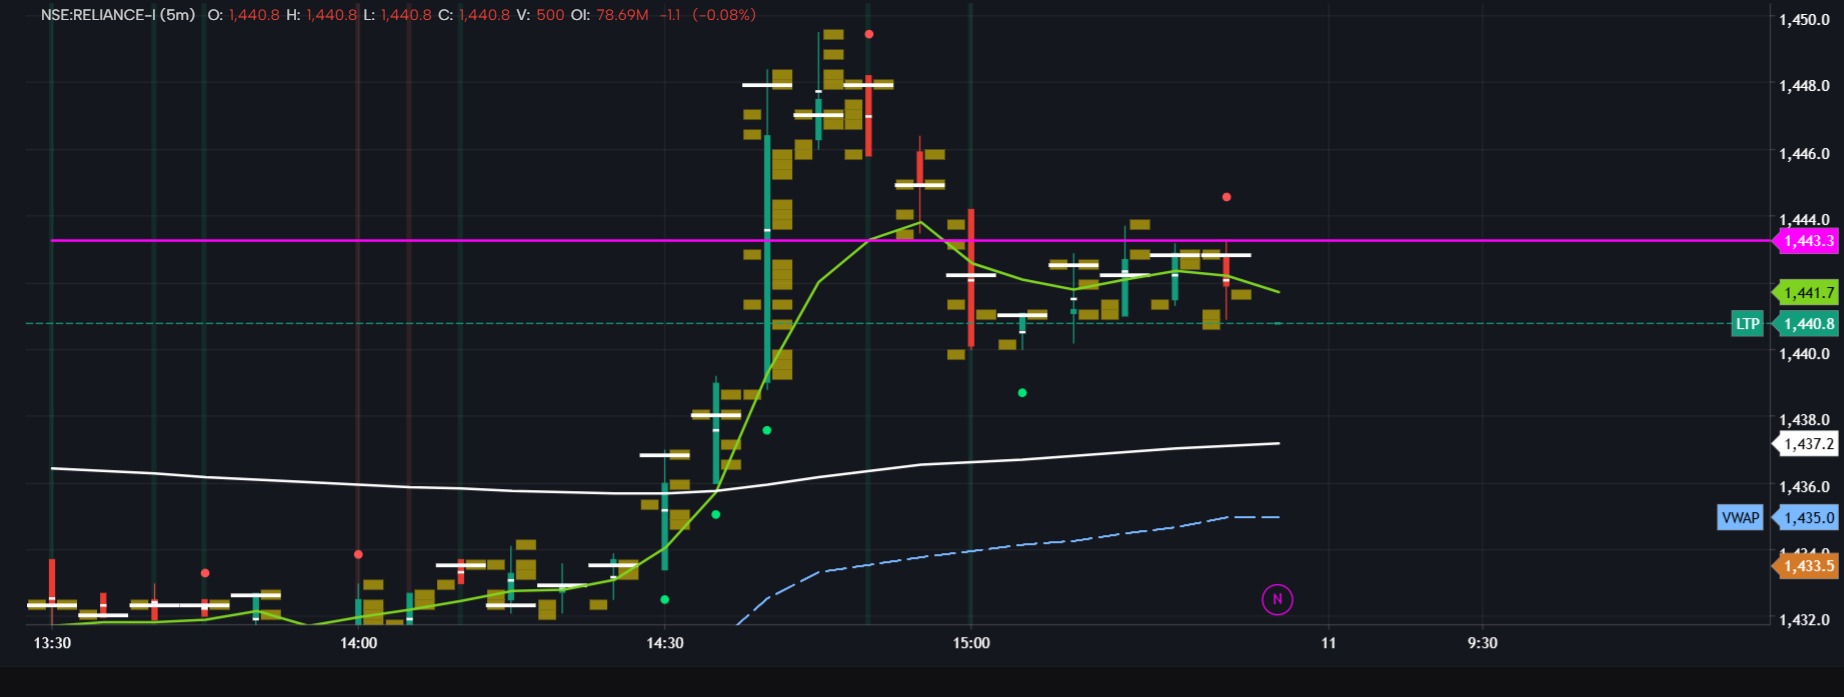
COT 3x Circle Marker — Logic & Usage
COT 3x Circle Marker is an orderflow-based visual indicator that compares COT High and COT Low values on every candle.
The purpose of this indicator is to quickly highlight candles where one side of COT activity is 3 times or more stronger than the other side.
This helps traders identify candles where strong orderflow activity is concentrated either near the high of the candle or near the low of the candle.
Core Logic
For every candle, the indicator reads:
COTH = orderflow.cothigh
COTL = orderflow.cotlow
Then it compares the absolute values of both.
Top Circle Condition
A red circle above the candle is plotted when:
COTH >= COTL × 3
Example:
COTH = 30
COTL = 10
Since 30 is 3 times 10, a red circle will be printed above the candle.
This means COT High activity is strongly dominant compared to COT Low activity.
Bottom Circle Condition
A green circle below the candle is plotted when:
COTL >= COTH × 3
Example:
COTH = 100
COTL = 500
Since 500 is 5 times 100, a green circle will be printed below the candle.
This means COT Low activity is strongly dominant compared to COT High activity.
No Circle Condition
No circle is printed when the difference between COTH and COTL is less than the selected multiplier.
Example:
COTH = 50
COTL = 40
Here, neither side is 3 times greater than the other, so no signal is plotted.
How To Read The Circles
Red Circle Above Candle
A red circle means:
COT High is 3x or more greater than COT Low
This shows strong activity near the candle high.
It can be useful for identifying:
aggressive activity near the high
possible supply/rejection zone
possible breakout participation
possible trap if price fails to continue above that candle
Important: A red circle is not automatically a sell signal.
Its meaning depends on location and follow-through.
Green Circle Below Candle
A green circle means:
COT Low is 3x or more greater than COT High
This shows strong activity near the candle low.
It can be useful for identifying:
aggressive activity near the low
possible demand/absorption zone
possible bounce area
possible breakdown pressure if price fails to recover
Important: A green circle is not automatically a buy signal.
Its meaning depends on price location and confirmation.
Practical Trading Usage
Use this indicator as an orderflow imbalance attention marker, not as a standalone buy/sell indicator.
Best confirmation tools:
VWAP
VPOC
volume profile levels
previous day high/low
support and resistance
footprint imbalance
delta/CVD
candle close confirmation
market structure
Best Use Cases
1. Reversal Setup
If a green circle appears near support, VWAP, VPOC, or previous demand zone, and price starts holding above that candle, it may indicate possible absorption or reversal.
Confirmation:
Green circle + support zone + next candle holds low + bullish close
2. Rejection Setup
If a red circle appears near resistance, VWAP rejection, VPOC rejection, or previous supply zone, and price fails to continue higher, it may indicate possible rejection or trap.
Confirmation:
Red circle + resistance zone + next candle fails high + bearish close
3. Breakout Continuation
If a red circle appears during a strong breakout and price closes above resistance with volume, it may support breakout continuation.
Confirmation:
Red circle + breakout candle + close above level + follow-through candle
4. Breakdown Continuation
If a green circle appears during a breakdown and price closes below support with selling pressure, it may support downside continuation.
Confirmation:
Green circle + breakdown candle + close below support + follow-through candle
Settings
Compare Multiplier
Default value:
3.0
This means one side must be at least 3 times greater than the other side.
Aggressive traders may reduce it to 2.5.
Conservative traders may increase it to 4.0 or higher.
Circle Offset ATR Multiplier
This controls the distance of the circle from the candle high or low.
It uses ATR so the circle position adjusts according to market volatility.
Circle Size
Controls the thickness/visibility of the plotted circle.
Important Note
This indicator does not predict direction by itself.
It only highlights candles where COT High or COT Low is strongly dominant.
Always combine it with market structure, VWAP/VPOC location, support-resistance, and next candle confirmation before taking trades.
Simple Interpretation
Red circle above candle = COTH is 3x or more than COTL
Green circle below candle = COTL is 3x or more than COTH
No circle = no strong 3x COT dominance
Best use: Identify high-interest orderflow candles and then wait for confirmation.
The information and publications are not meant to be, and do not constitute, financial, investment, trading, or other types of advice or recommendations supplied or endorsed by GoCharting. Read more in the Terms of Use.
Comments (0)
Loading comments…