 XAUUSD
orderflow

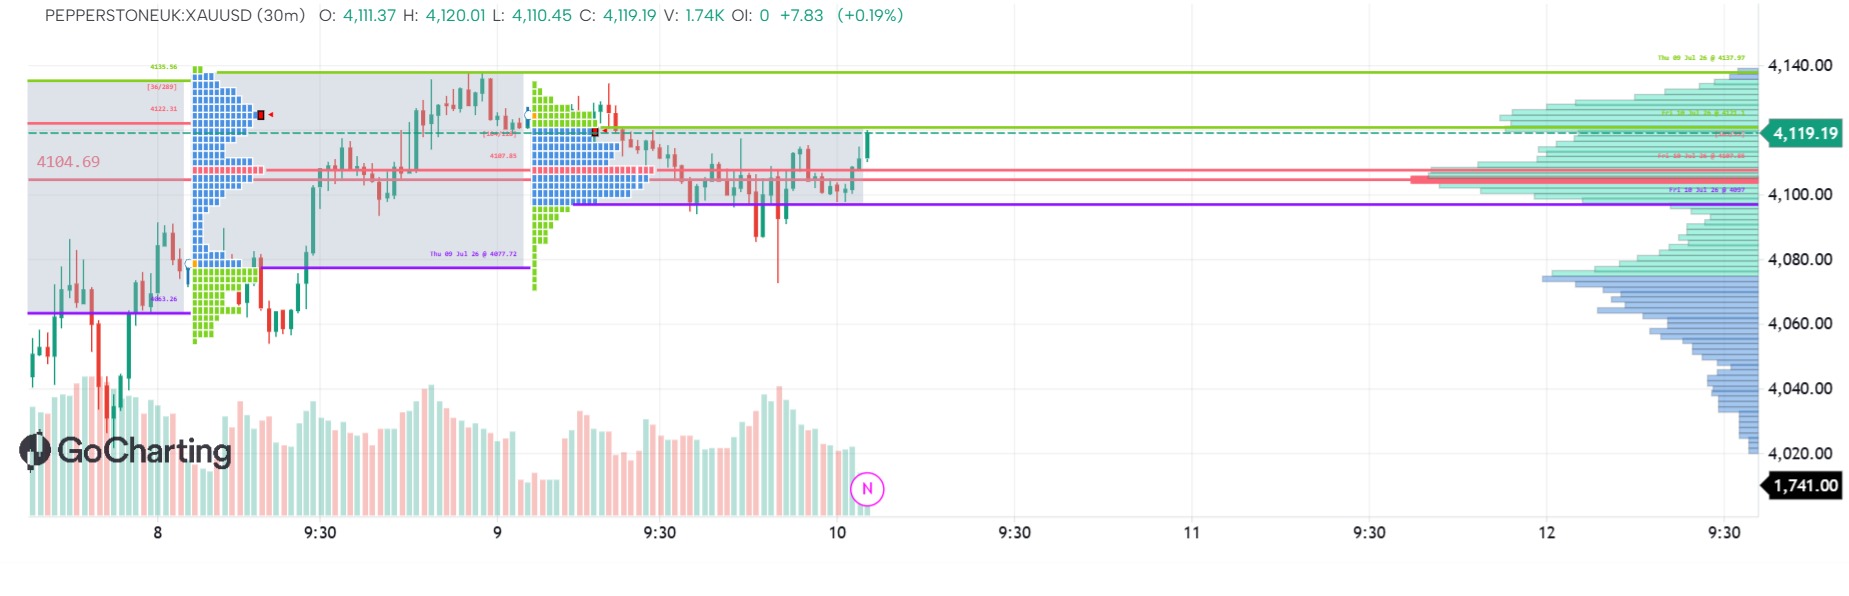
indicator("OrderFlow CVD Signal", overlay=false)
// per-bar order flow
delta = orderflow.delta
buyv = orderflow.buyvolume
sellv = orderflow.sellvolume
totv = buyv + sellv
// session CVD, reset at 09:15
inSession = (hour == 9 and minute >= 15) or (hour > 9 and (hour < 15 or (hour == 15 and minute <= 30)))
isStart = (hour == 9 and minute == 15)
static int cvd = na
static int prevCvd = na
prevCvd := cvd
if isStart {
cvd := delta
} else if inSession {
cvd := cvd + delta
} else {
cvd := na
}
// aggression: bar delta >= 60% of bar volume, one-sided
strongBuy = totv > 0 and delta > 0 and (delta * 100) > (60 * totv)
strongSell = totv > 0 and delta < 0 and ((0 - delta) * 100) > (60 * totv)
// CVD zero-cross = flip in net-aggression control
crossUp = prevCvd != na and cvd != na and prevCvd <= 0 and cvd > 0
crossDn = prevCvd != na and cvd != na and prevCvd >= 0 and cvd < 0
// signal: cross AND aggression same direction
static int signal = na
if crossUp and strongBuy {
signal := 1
} else if crossDn and strongSell {
signal := -1
} else {
signal := 0
}
plot(cvd, color=color.teal, title="Session CVD")
plot(signal * 100, color=color.orange, title="Signal (+100 long / -100 short)")
hline(0, color=color.red, style=hlineStyle.dotted, title="Zero")
The information and publications are not meant to be, and do not constitute, financial, investment, trading, or other types of advice or recommendations supplied or endorsed by GoCharting. Read more in the Terms of Use.
Comments (0)
Loading comments…