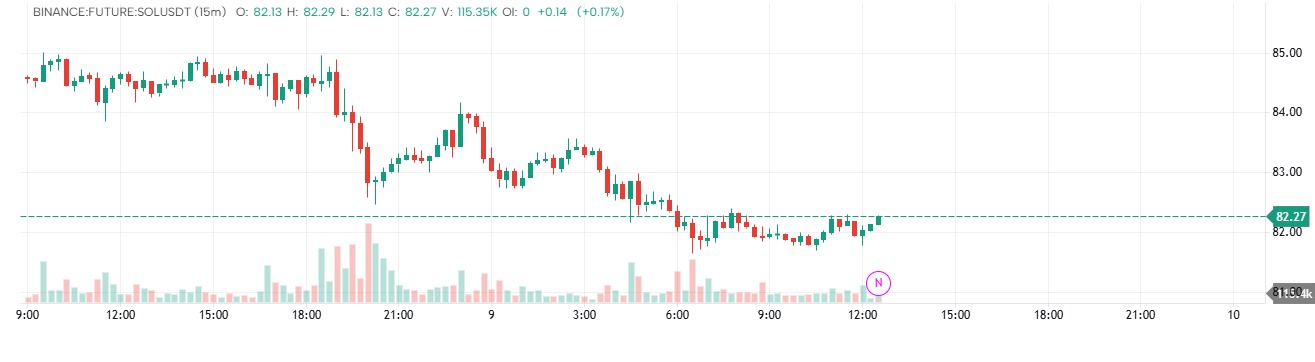
← All Analyses SOLUSDTneutral
oder flow

//@version=5
indicator("Simplified Footprint", overlay=true)
// Get volume and close direction
isUp = close >= open
upVol = isUp ? volume : 0
downVol = isUp ? 0 : volume
// Plot as horizontal lines on each bar
plotshape(isUp, title="Buy Volume", location=location.abovebar,
color=color.green, style=shape.label, text=str.tostring(upVol))
plotshape(not isUp, title="Sell Volume", location=location.belowbar,
color=color.red, style=shape.label, text=str.tostring(downVol))
Disclaimer
The information and publications are not meant to be, and do not constitute, financial, investment, trading, or other types of advice or recommendations supplied or endorsed by GoCharting. Read more in the Terms of Use.
Comments (1)
Loading comments…