buy vs sell Delta

Buy vs Sell Delta (Aggression) – Indicator Analysis
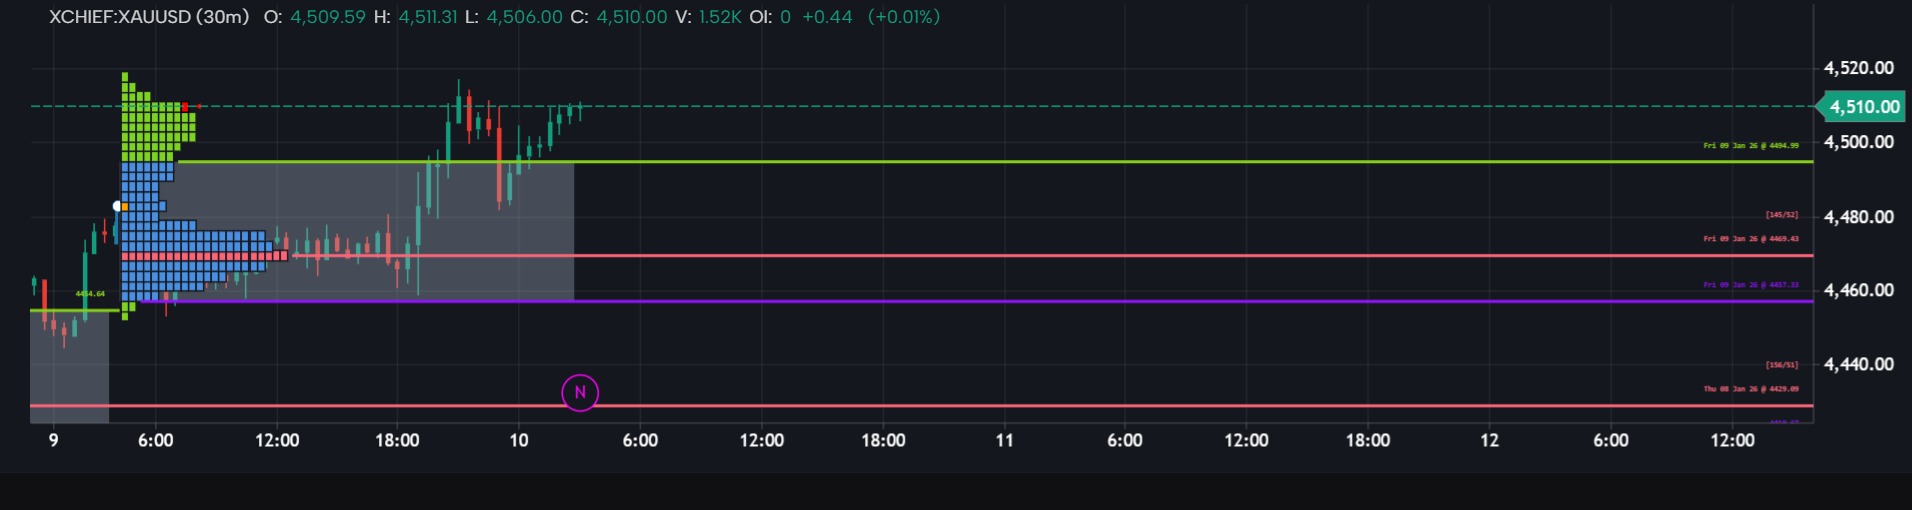
This indicator visualizes buyer vs seller aggression in real time using a price–volume delta approach, suitable for Forex and Crypto spot markets where true bid–ask volume is not available.
The logic classifies:
Up candles → Buy volume
Down candles → Sell volume
The delta histogram (Buy − Sell volume) highlights which side is more aggressive:
Green bars indicate buyer dominance
Red bars indicate seller dominance
This tool is especially effective for:
Identifying momentum strength
Spotting delta divergence (price vs aggression)
Confirming trades near VWAP, support & resistance
Best used on lower timeframes (1–5 min) for scalping and higher timeframes for momentum confirmation.
It does not predict direction but helps confirm who is in control of price movement
The information and publications are not meant to be, and do not constitute, financial, investment, trading, or other types of advice or recommendations supplied or endorsed by GoCharting. Read more in the Terms of Use.
Comments (0)
Loading comments…