What is a Volume Profile
In the stock market, a volume profile is a graphical representation of the traded volume at various price levels over a predetermined time period. It gives traders information about areas where there has been a lot of trading activity, which aids in identifying important resistance as well as support levels. The profile is a graphic that resembles a histogram and shows the volume of trades at various price levels.
It identifies a value area encompassing a certain portion of the total traded volume and attracts attention to the price point with the largest amount of transactions (the Point of Control). In order to comprehend market dynamics and prospective price movements, traders analyze volume profiles to make educated judgments, identify areas of interest, and design trading strategies based on the distribution of trading activity.
Volume Profile Components
The volume profile is composed of three key elements that, taken together, offer perceptions of trade activity and price levels over a specific amount of time:
Volume: The sum of all shares, contracts, or units exchanged at a specific price level over the specified time frame. While low-volume locations frequently denote places with less trading activity, high-volume levels indicate regions with strong market interest.
Price Range: The price range is broken up into intervals or segments, each of which symbolizes an entirely distinct price level. You are able to customize these intervals based on increments like dollars or ticks. The volume profile analyzes trading activity within each price band in order to offer a depiction resembling a histogram.
Time Period: The volume profile has been estimated over a predetermined amount of time, like a day, week, or month. The selection of the time period affects the interpretation of the data as well as the level of accuracy of the research. Different epochs might have provided many different perspectives on market behavior.
Volume Profile Indicators
Indicators of the volume profile provide traders with essential information. The price level with the highest traded volume is known as the Point of Control (POC), identifying a key region of interest.
The Value Area designates a price range with a certain percentage of the overall traded volume, which helps identify critical price ranges.
Volume gaps indicate regions with little trading activity. With the use of these volume profile indicator, traders might describe themselves as having important levels of support and resistance, anticipate future breakouts, and base their judgments on how trading volume is distributed across various price levels.
Volume Profile Strategies
Trading insights have been employed by traders using volume profile strategies.
Trading at Key Levels: For the purpose of identifying important support and resistance levels for well-informed entries and exits, traders employ high-volume areas, POC, as well as value zones.
Breakout Trading: By identifying price movements outside of the value zone, traders can foresee powerful trends and potential breakout chances.
Scalping: Using the trading volume profile, traders identify brief price changes and promptly place trades in order to generate profits.
Volume Clusters: Identifying places of high volume might help identify potential turning or continuation locations.
The aforementioned strategies make the most of volume profile analysis to improve judgment, hone risk control, as well as maximize trade results.
Also Read : Key Indicators for Order Flow Trading: Identifying Market Sentiment
Determining Volume Profile Time Frames
Accurate analysis is contingent upon choosing the appropriate volume profile time frames. Short-term traders might pick intraday time frames (such as minutes or hours) in order to monitor quick price movements. Swing traders frequently employ daily or weekly profiles to find bigger trends. From a macro perspective, long-term investors may be concerned themselves about monthly or even yearly profiles.
The time range chosen has to accommodate the trader’s objectives as well as the trading approach. Shorter time frames offer accurate details, while longer ones provide more powerful context. It is of the utmost importance to strike a balance between the granularity of the data as well as the desired insights. The correct implementation of volume profile analysis for informed decision-making has been made possible by modifying time frames as market conditions change.
Volume Profile Charting Software
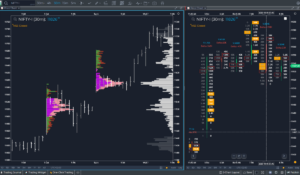
GoCharting is an effective volume profile charting platform that traders and investors use for analyzing market dynamics. GoCharting allows customers to produce thorough volume profile charts thanks to its intuitive interface and sophisticated capabilities. Trading activity dispersion enables traders to understand crucial levels, see volume clusters, and make well-informed judgments.
GoCharting’s implementation of volume profile indicator like the Point of Control (POC) as well as Value Area enhances the accuracy of the analysis. It helps traders react to many different market conditions by accommodating a variety of time frames. GoCharting offers a full platform for successfully integrating volume profile data into trading methods, whether for day trading, swing trading, or investing over the long term.
Conclusion
A key resource for traders seeking a deeper understanding of market dynamics is the volume profile. Trading activity can be visualized based on volume throughout various price levels, permitting traders to quickly recognize areas of support and resistance, prospective breakouts, including reversals.
The indications for the Point of Control as well as Value Area enhance decision-making even further. The trading strategy, whether intraday or longer-term, determines the time frame that should be utilized. The analysis procedure has been simplified by using specialized charting platforms like GoCharting. Volume Profile could provide you with a competitive edge and an enhanced understanding of market patterns when you implement it into your trading system.