An innovative and effective strategy in the field of day trading is tick chart trading. This thorough introduction explores the subtleties of tick charts, revealing their importance, interpretation, as well as advantages. By learning more about their subtleties, traders could use the granular information tick charts offer to make informed decisions.
This guide presents traders with a comprehensive picture, enabling strategic choices by contrasting tick charts with traditional charting techniques. Whether you’re a beginner or an experienced trader, transforming into proficient with tick charts could improve the depth of your trading understanding as well as enhance your probabilities of success in today’s lightning-fast markets. Just read this article and gain some useful knowledge regarding tick charts completely.
What Are Tick Charts?
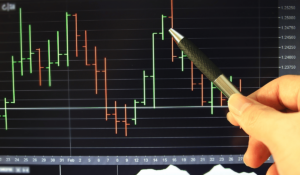
Tick charts are financial charts that are used in trading to show market activity based on transaction volume rather than time intervals. Unlike typical time-based charts (such as candlestick or bar charts), in which each candlestick demonstrates a given time period, tick charts represent a specified number of trades or transactions.
A new candlestick or bar has been generated in tick charts after a particular amount of trades have occurred, regardless of time. In a 100-tick chart, for example, a new bar becomes established after every 100 deals. During periods of high volatility, this strategy provides an even more granular view of market activity as well as minimizes the number of bars during periods of low activity.
Tick charts may offer traders insight into the order flow, price volatility, as well as market momentum. They are especially helpful to active day traders who want to react immediately to changes in the stock market as well as capture short-term price swings.
How to Read Tick Charts?
Understanding the distinctive features of tick charts is necessary to read them:
Candle Representation: Each candle on a tick chart stands in for a certain amount of trades. In those deals, a shorter candle denotes less price movement, while a longer candle denotes greater volatility.
Price Range: A candle’s level vertically indicates the price range that has been covered by trades. Traders have the ability to assess the severity of price movements rapidly.
Tick Value Flexibility: In accordance with the state of the market, traders are able to change tick values. Larger tick numbers offer clarity during calm periods, whereas smaller tick values are appropriate for volatile markets, recording quick movements in prices.
Patterns and Trends: Analyze patterns and trends on the tick chart, such as breakouts, reversals, as well as trends. Finding these patterns enables traders to know in advance possible fluctuations in prices while arriving at decisions quickly.
Also Read : Backtesting Trading: A Step-by-Step Guide
Using Tick Charts For Day Trading
Due to their real-time information, tick charts or tick chart trading are essential for day trading. In contrast to typical time-based charts, traders may quickly identify small price swings. Day traders can profit from swift market changes by seeing patterns, establishing entry and exit points, using scalping techniques, and analyzing volume.
Tick charts offer precise price representation, decreased noise, and customization choices that are compatible with different trading approaches. Trading decisions can thus be made that are more intelligent and successful as a result of being able to react to various market situations.
Advantages of Trading Tick Charts
Accurate Price Movement: A precise picture of price changes based on actual pertains made can be obtained by tick charts, which eliminate the influence of time.
Real-time Insights: When using a tick chart trading strategy, traders have immediate accessibility to information about the swift market swings, facilitating quick actions regarding changing circumstances as well as improving decision-making.
Noise reduction: By focusing on the trading process, tick charts screen out low-volume intervals, eradicating pointless market noise and therefore facilitating far more precise identification of trends.
Customization: Trading styles might be customized by changing the tick values on the tick chart that correspond to many different fluctuations in the market levels.
Micro Level Analysis: Tick charts show minute price fluctuations and patterns, which makes them particularly advantageous for short-term trading strategies like scalping, where minute-to-minute movements in prices count. These benefits enable traders with effectiveness to identify intraday chances as well as execute orders.
Comparing Tick Charts to Other Charting Methods
When compared to other charting approaches, it is clear that tick charts provide real-time precision by focusing on trading volume. Unlike time-based charts or Renko charts, tick charts capture and decrease noise in the market. While range charts stress price movement inside predefined ranges, volume charts take into consideration transaction activity.
Tick charts are especially useful for short-term plans, as they provide insights into micro-fluctuations that other methods may miss. Traders might choose which is the most appropriate chart type based on their trading objectives, timeframes, as well as market conditions.
Also Read: What is Paper Trading ? Benefits of Paper Trading
Conclusion
Tick chart trading is an effective method for traders who want to analyze short-term price changes and execute accurate trades. Tick charts provide insights that might be especially valuable for day traders and scalpers because they focus on trading activity rather than time. In volatile markets, their capacity to filter out noise as well as react to market conditions increases their effectiveness.
Tick charts, like any trading strategy, have their own set of concerns and restrictions. Before carrying out tick charts into their tactics, traders must comprehend their trading style, market conditions, as well as the strengths of tick charts. Traders can make informed judgments about which include tick charts in their trading toolkit shortly after reading this article.