Traders continually search for tools that may give them useful insights into price fluctuations as well as market dynamics because of the constantly changing financial industry environment. One such tool that has gained popularity is the Market Profile Indicator since it may give a distinctive viewpoint on market behavior.
Comprehensive descriptions of the Market Profile’s components, functionality, interpretation, trading applications, advantages, and cons, as well as practical usage advice are provided in this extensive post. You’ll have an in-depth understanding of the Market Profile Indicator and how it can improve your trading tactics by the end of this article.
Understanding Market Profile
A representation in graphic form of price, time, as well as volume data, is called a “market profile,” because it shows the market activity in real-time. When compared to conventional price charts like candlesticks or bar graphs, Market Profile arranges data into bars that are horizontal called Time Price Opportunities (TPOs). These TPOs show how long the market traded at particular price levels during that specific trading session.
Also Read : Volume Profile: The Ultimate Guide
Components of the Market Profile
1. Time Price Opportunity (TPO): Usually shown as vertical bars on a chart, TPO illustrates the price levels at which trading happened during particular time intervals. These bars enable traders to assess market mood by pointing out areas of high and low trading activity.
2. Value Area: This element pinpoints the price range where most trading activity takes place during a given time frame. Typically covering 70% of the TPO, it offers traders a benchmark for determining fair value.
3. Point of Control (POC): The POC is the price level in the value area with the greatest number of TPOs. It serves as a key reference point for traders because it denotes the price level where the market spent the majority of the time during the specified period.
4. Initial Balance (IB): The initial balance (IB) of a trading session is the price range that the first several TPOs encompass. It’s essential for determining the direction of the market early on and can aid traders in spotting breakout or reversal opportunities.
5. Single Prints: TPOs that do not overlap with the TPO distribution from the prior day are referred to as single prints. These solitary prints frequently suggest possible trading opportunities by pointing out areas of abrupt and large price fluctuation.
How the Market Profile Works
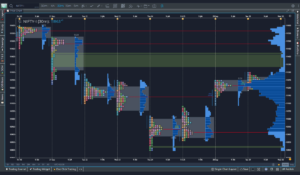
In order for the Market Profile to function, price, time, as well as volume data are arranged into a graphic representation called the “Profile.” Each horizontal bar in the resulting histogram of Time Price Opportunities (TPOs) shows the amount of time spent trading at a particular price level.
With the help of this graphic, traders are able to identify areas with high and low trading activity, pinpointing extremely important levels of support and resistance as well as where prices spent the most time.
Trading decisions can be improved by gaining insight into market emotion, prospective trend reversals, as well as areas of price acceptance or rejection by analyzing the distribution of activity on the market.
Also Read: Comparison of Bookmaps with Footprints, Volume Profiles, and DOM
Interpreting Market Profile Charts
To identify crucial market levels, it is necessary to examine the distribution of Time Price Opportunities (TPOs) when interpreting Market Profile charts. The day’s Point of Control (POC), shown by the highest point on the profile, denotes a price where trading activity was focused.
The Value Area, which normally makes up 70% of TPOs, depicts the trading range. To locate areas of support and resistance, measure market sentiment, and foresee prospective price changes, traders analyze TPO distribution. Making wise trading decisions requires knowledge of the profile’s location and shape.
Using Market Profile in Trading
Trading incorporates a number of tactics while using Market Profile. In the profile, traders can check for price acceptance or rejection at particular levels to identify probable entry or exit points. The Value Area and Point of Control help identify zones of interest for placing stop-loss as well as take-profit orders.
Market Profile is additionally helpful in identifying changes in market mood along with prospective trend reversals. Combining this data with additional technical and fundamental research tools helps improve trading decisions by giving an in-depth understanding of the market environment while also improving overall trading results.
Also Read : What is Paper Trading ? Benefits of Paper Trading
Advantages and Limitations
Advantages:
- Market Profile provides a distinctive viewpoint on price information and market dynamics.
- It offers a crystal-clear visual representation of market activity.
- Support and Resistance: Assists in determining important degrees of support and resistance.
- Assessing market mood and potential trend reversals is aided by market sentiment.
Limitations:
- Market Profiles can be complicated and may require some learning.
- Traders’ interpretations may differ.
- It might not be as useful for trading in the very short term.
- It works best when combined with other analysis techniques.
Tips for Effective Use
Understanding and practice are both necessary for the Market Profile Indicator to be used effectively. Here are six suggestions to increase its usefulness:
1. Study and Gain Knowledge: Take the time to fully comprehend Market Profile concepts, such as Value Area, Point of Control, as well as TPO distribution.
2. Employ Patience: Watch for distinct profiles to come into play, especially in the first hour of trading. Trading needs to be discouraged when the market is choppy or uncertain.
3. Combine with Other Tools: For a more in-depth comprehension of the market, use Market Profile in conjunction with other technical and fundamental analysis tools.
4. Track Volume: Keep track of volume along with Market Profile to confirm price changes as well as spot potential for fascination zones.
5. Keep a Trading Journal: Keep a journal to document your market profile-based observations as well as transactions. This is going to assist you in improving your trading strategies over time.
6. Risk management: If you want to safeguard your capital while trading with Market Profile, implement good management of risk strategies which might include placing orders for stop losses as well as position sizing.
Conclusion
A useful tool that provides investors with a particular understanding of the form and behavior of the stock market is the market profile indicator. Understanding its elements, thoroughly analyzing charts, as well as integrating them with other techniques for analysis help traders make decisions that are more accurate.
Market Profile can prove to be a useful tool for navigating the complexities of stock markets, regardless of some of its limitations, in order if utilized properly.