
NSE options have become well-known as adaptable financial products in the fast-paced world of trading. NSE Option Charts are essential resources that traders rely on to properly navigate this dynamic environment. These charts offer vital information about price changes, market mood, as well as prospective trading opportunities.
This thorough guide explores the world of NSE options, their significance, different types of options charts, interpretation methodologies, advantages, charting tools, successful strategies, and difficulties in order to provide traders with the information they require in order to make wise judgments about the options market.
What is NSE Options ?
The National Stock Exchange (NSE) of India’s options market is commonly referred to as NSE. These financial derivatives give investors an opportunity to either buy (call option) or sell (put option) underlying assets consisting of stocks or indices at fixed prices and expiration dates without putting them under any sort of contractual obligation.
In the Indian stock market, NSE Options offer traders chances for making assumptions, hedging, as well as risk management. They are well-liked for their ability to adapt as well as the possibility of profit, thereby rendering them a significant component of India’s stock markets.
Importance of Option Charts
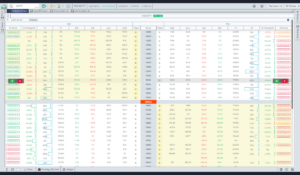
For investors as well as traders in the stock market, option charts constitute essential tools. They provide traders with an overview of the past and present price fluctuations of options contracts, enabling them to assess volatility, patterns, as well as probable entry and exit locations.
In order to assist with strategy formulation and risk assessment, option charts also include important parameters which include estimated volatility as well as open interest. They give traders valuable knowledge regarding market mood as well as may be helpful in decision-making, increasing their chances of success in the demanding realm of options trading.
Also Read: Nifty PCR Chart: Analyzing Trends and Strategies
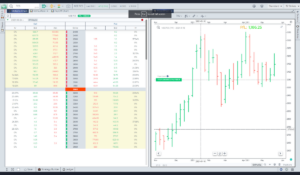
Types of NSE Option Charts
The NSE provides many types of option charts, including:
1. Line charts: Straight lines which show the evolution of option pricing.
2. Candlestick charts: Display movements in prices along with figures for the high, low, open, as well as close.
3. Bar charts: Using vertical bars, bar charts show option data such as open, closed, high, and low prices.
4. Volume charts: Help in identifying trends as well as trend reversals by showing trade volume alongside price data.
5. Charts of implied volatility: Reflect changes in option volatility, essential for determining option pricing as well as strategy.
Interpreting NSE Option Charts
Understanding price trends, volatility patterns, and important indicators is necessary for interpreting NSE option charts. Potential reversals can be predicted by patterns including bullish or bearish engulfing, doji, or head and shoulders. Implied volatility charts, which display volatility trends, are capable of being utilized to determine market mood.
Open interest and volume, two important indicators, shed light on option liquidity and trader activity. These factors work together in order to help traders in choosing options trading methods.
Benefits of Using Option Charts
The advantages of using option charts for trading and investing are numerous. In addition to helping in the identification of trends, support, as well as resistance levels, they offer visual insights into both present and historical price movements. Making decisions about entry and exit places has become easier as a consequence. Option charts additionally demonstrate important indicators including implied volatility, so they make it easier to evaluate risks as well as design strategies.
They may be helpful with analyzing market sentiment through data on volume and open interest. These charts improve traders’ ability to effectively control risk, optimize trading tactics, as well as raise their probabilities of success in the challenging realm of options trading by providing a thorough view of the options market.
NSE Option Charting Tools
Tools for option charting are available from NSE, including NSE Pathshala, NSE NOW, and NSE Market Tracker. NSE Pathshala provides teaching materials as well as simple charting tools. An advanced charting feature-rich trading platform is NSE NOW.
For the purpose of informing traders, NSE Market Tracker offers real-time data, which includes option charts.
From novices to seasoned professionals, these tools support a variety of traders and aid in their decision-making in the options market.
Tips for Effective Charting
1. Pick the Right Timeframe: Decide on a period that is compatible with your trading style and your plan.
2. Key Indicators: Use a few that are important technical indicators in order to gain an improved comprehension of price patterns as well as probable reversals.
3. Determine Support and Resistance: In order to determine both entering and exiting spots, highlight critical encouragement and opposition levels.
4. Utilize risk management: Position sizes need to be determined in accordance with your risk tolerance, with stop-loss orders implemented to limit losses.
5. Stay Informed: Remain informed by taking into consideration economic news and events that could potentially have an impact on the market and by fusing statistical analysis with charting.
Navigating NSE Option Chart Challenges
The complexities of the NSE Option chart need to be navigated with caution. The challenges that arise include:
1. Illiquidity: For the reason of their low volume of trading, certain stock options have the potential to be challenging to execute.
2. Data Accuracy: Reliable analysis varies depending on the reliable nature of the data sources.
3. Complexity: Options entail subtleties that necessitate an in-depth comprehension of concepts which include the decay of time as well as predicted volatility.
4. Market Events: The pricing of options may be considered quickly influenced by external events, making real-time monitoring essential.
5. Risk management: Options trading is capable of resulting in substantial losses if it fails to be conducted carefully, therefore utilizing risk management is critically important.
Conclusion
Trading in the options market effectively necessitates an understanding of NSE Option charts. These charts offer helpful data on price changes and market mood, empowering traders to make informed decisions.
Traders may use NSE Option charts to further develop their trading strategies as well as reach their financial objectives in this constantly shifting and challenging market by comprehending the various chart styles, correctly analyzing data, as well as employing the appropriate tools.