Access to accurate and real time market generated information is crucial for making trading decisions. Professional traders know that being able to catch a directional change early increases your risk-to-reward ratio.This improves your trading edge due to information asymmetry. But how do professionals analyze these charts in real time to catch these early signs of market change? They analyze order flow footprint charts to get a clear understanding of supply and demand within each candle as it happens.
Order flow data using footprint charts gives an accurate perspective on market dynamics. We’ll deep dive into the world of footprint charts in this manual, learning what they’re for, how to read them, which ones are the best, how to use them to start trading futures, and how to analyze order flow using them.
This manual will offer you useful insights to improve your trading, whether you are a beginner trader or a seasoned professional.
What Are Footprint Charts?
Footprint charts, also referred to as volume footprint charts or order flow charts, gives a birds-eye view of trading activity over a specified period of time within each candle. Footprint charts incorporate volume information as opposed to conventional price charts, which only show price changes, enabling traders to see the buying and selling pressure at each price level.
Trading professionals can spot trends, identify key levels of support and resistance, and predict future price movements more precisely by examining the distribution of volume and order flow.
How to Read Footprint Charts?
Although initially reading footprint charts may seem difficult, with practice it becomes simpler to interpret the data they provide. Typically, the chart shows a series of vertical bars, each bar denoting a different price level.
Whether the trade took place at the asking price or the bid price is indicated by the color of the bars. Each bar’s size reflects the trading volume at that price level, giving important information about the supply and demand dynamics of order flow.
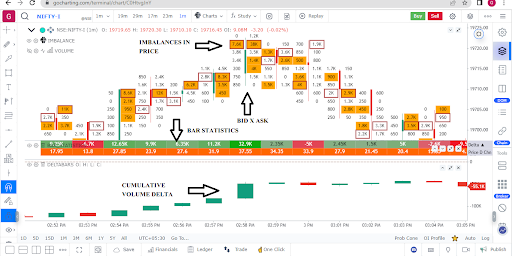
A footprint chart shows various information, including volume, bid-ask spreads, cumulative volume delta and order flow imbalances, for each bar that represents a particular price level.
Trading decisions can be made more intelligently by analyzing these factors, which provide traders with information about market sentiment and who is in control of the market.
Best Footprint Charts
Footprint charts are available on a number of software platforms, each with a different set of features and customizations. GoCharting brings you the best features at affordable prices right within your browser and mobile. You don’t need to buy expensive software and configure it with a separate data subscription anymore. Just pay and start using our footprint charts within seconds.
GoCharting users have access to a wide variety of tools that they can use to assess order flow, see supply and demand within the candle, and identify trading opportunities accordingly. Traders can make informed decisions based on market activity thanks to customizable features, real-time data, and sophisticated order flow analytics.
Finding the charting platform that best suits your trading style and preferences requires research into and comparison of various charting platforms.
How To Analyze Order Flow Using Footprint Charts?
Effective use of footprint charts depends on understanding order flow. Here are some strategies that traders frequently use:
1. Stacked Imbalances:
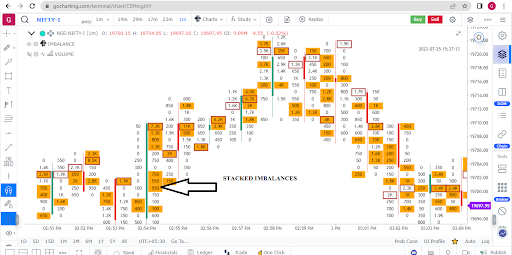
When numerous sizable buy or sell orders assemble at particular price levels, stacked imbalances develop. These imbalances signal high supply or demand and frequently come before major price changes and particularly near key interest levels. Traders can predict potential breakouts or reversals by spotting stacked imbalances on a footprint chart. Even better, traders can now visualize if a particular breakout will sustain or fail to manage risk according to how the market is reacting. This is not possible with OHLC candlestick charts. GoCharting not only helps visualize these imbalances but it automatically marks dynamic support and resistances that are hidden from the common eye.
2. Unfinished Auctions:
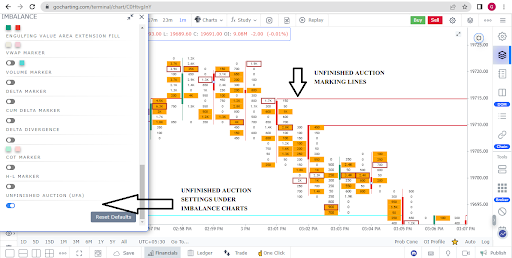
An unfinished auction is one where a significant amount of trading volume is still unmatched. The price frequently returns to these levels in the future because they serve as areas of interest for market participants. To find unfinished auctions and predict potential support or resistance zones, traders can use gocharting footprint charts. GoCharting automatically marks unfinished auctions.
3. Volume Profile:
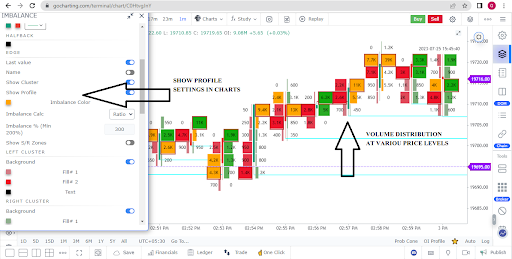
Analysis of the volume distribution at various price levels is done using the volume profile. Traders can locate hot spots of liquidity and potential market turning points by understanding where there is a significant amount of trading activity within each candle. Trading decisions can be improved by using footprint charts, which offer a visual representation of the volume profile.
Footprint Trading Techniques
It takes a combination of technical analysis and market dynamics knowledge to create profitable trading strategies using footprint charts. Several well-liked footprint trading methods are listed below:
1. Absorption: This strategy aims to pinpoint price levels where significant volume imbalances are taken up by competing market participants. Indicators of absorption, which may point to a trend reversal or continuation, are sought after by traders on the footprint chart.
2. Confirmation of Breakout Patterns: Footprint charts can be used to verify breakout patterns seen on conventional price charts. To confirm the strength of a breakout and estimate the likelihood that a trade will be profitable, traders examine the order flow dynamics during the breakout.
3. Stop-Run Reversals: This tactic entails locating price levels where stop-loss orders are likely to be executed, prompting a sharp price reversal. On a footprint chart, traders watch the order flow and volume spikes to spot stop-run reversals and profit from the subsequent price movement.
How To Start Trading Futures With Footprint Charts:
Here are a few actions to take if you want to start using footprint charts in your trading strategy:
1. Pick an Honest Charting Platform: Opt for an honest charting platform that provides accurate footprint charts and the tools required for learning orderflow.
2. Educate Yourself: Take the time to learn the theories and methods involved in deciphering and interpreting footprint charts. We have created a playlist of youtube videos for you to learn orderflow footprint charts.
3. Paper Trading: Practice trading with footprint charts using a simulated or paper trading account before risking real money. This enables you to become acquainted with the platform and test various tactics without suffering monetary losses.
4. Create a Trading Plan: Based on your examination of footprint charts, specify your trading objectives, risk tolerance, and approach. You’ll be able to make disciplined and consistent trading decisions if you have a clearly defined trading strategy.
5. Start Trading: You can start trading futures using footprint charts once you feel confident in your trading abilities. Smaller position sizes should be used initially, and they should be gradually increased as experience and consistent profitability are attained.
Final Words:
This in-depth trading guide has given readers a thorough understanding of footprint charts and how they can be used to analyze order flow and make wise trading decisions. Traders can visualize volume and price movements using footprint charts, which provide them with insightful information about market dynamics.
Trading professionals can interpret data on a bid and ask for imbalances, volume profiles, and open auctions by learning how to read footprint charts. The ability to spot potential trading opportunities, such as stacked imbalances or regions of high volume concentration, is provided by these insights. Trading professionals should take their unique needs and preferences into account when selecting the best footprint charts. Strong footprint charting tools are offered by a variety of software platforms, enabling traders to tailor their charts to their trading strategies.